How to Draw a Trend Line

A trend line is a straight line drawn through two or more rising lows in an uptrend, or falling highs in a downtrend. Two points define the line and the third touch is what tests it. Its slope describes how fast the trend is moving, and a close through it is treated as the trend ending.
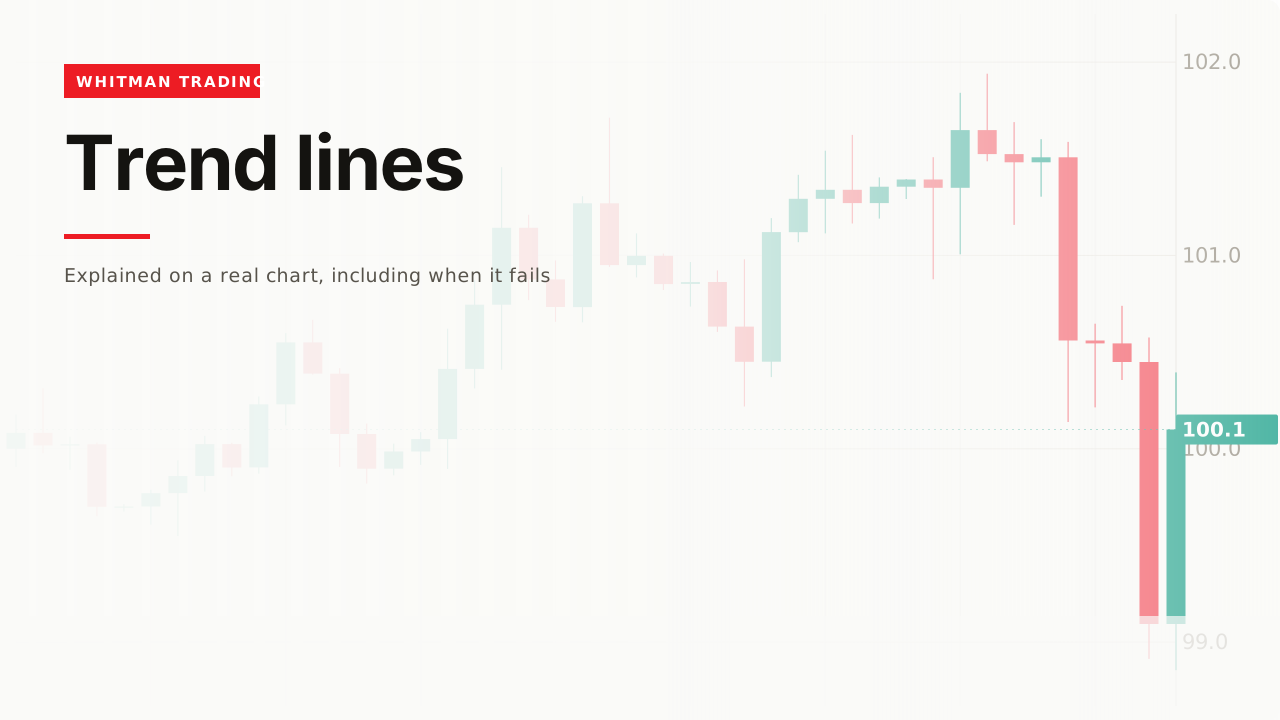
The most drawn thing on any chart, and the one where two competent people most often disagree. This page is about how to draw one consistently, and why the flexibility is the problem.
How it forms
A trend line joins two rising lows in an uptrend, or two falling highs in a downtrend.

Two points define a straight line, which means any two lows produce one. That is not analysis, it is geometry — and it is why a line with only two touches tells you nothing.

The third touch is the evidence. It is the first time the line predicted something and was right, and until it happens you have a line through two points like every other pair on the chart.
Wicks or bodies

Draw through the extreme lows, or through the closes. Both are defensible and they produce different lines, which means different break points and different stops.
The rule that matters is not which you pick. It is that you pick one and use it every time — switching between them mid-trade is how a line becomes whatever you need it to be.
The slope

A steady slope with price holding above is the whole positive reading. More usefully, a slope that keeps getting steeper is a trend accelerating — and accelerating trends end, because a line that steep cannot be sustained.
A line you have to redraw steeper every few days is telling you something. It is rarely a good something.
The break

The standard reading is that a close through the line ends the trend. Two qualifications make that usable:
A wick through is not a break. The same rule as support and resistance — price traded there and did not stay.
A break is not a reversal. A trend ending means the trend has ended. It does not mean the opposite trend has started, and treating a broken line as a short signal is how the next range takes your money.
The problem with a straight line
Worth understanding, because it explains why the line so often stops fitting.
A trend line assumes price advances at a constant rate. A straight line adds the same amount every bar — but trends do not, and the ones that matter usually accelerate.
So a line drawn early is too shallow within weeks: price runs away above it, and the line sits far below anything relevant. A line drawn late is too steep and gets broken by an ordinary pause.
This is why a moving average often works better as a rising floor. It bends. The moving average page covers that use, and the honest comparison is that a trend line is precise and rigid while an average is vague and adaptive.
Neither is right. But if you find yourself redrawing a line every week, the shape of the tool is fighting you rather than the market.
Why they get broken so often

A trend line is one of the most crowded levels on a chart. It is drawn by anyone with a mouse, in the same place, from the same two obvious lows — and everyone who bought the touches put a stop just underneath.
That is a pool of sell orders sitting at a known price, which is exactly what the liquidity page says price travels toward. Trend line breaks fail often, and this is why: the break is frequently the point of the move rather than the start of one.
A channel

Copy the line, move it to touch the highs, and you have a channel — a trading range on a slant. The edges do the same job: they are the places where being wrong is cheap.
A worked example
Two lows form. Draw the line, extend it, and do nothing. You have geometry.
Price approaches the line a third time. Now it is a test.
It holds and turns up. The line has earned something, and you have a stop: below the third low, not on the line, because the line is where everyone else’s stop already is.
Price runs, and later closes below the line. Not a short. It means the trend that was carrying your position is over, which is a reason to be out rather than a reason to be opposite.
The original data
Across our study of 24,971 trading videos, 127 cover trend lines. The median one gets 61,185 views, and only 49% fail to pass 50,000 — meaning more than half of them do.
That puts it just behind how to read a chart at 63,006 and far above 5,358 for breakouts and 2,513 for chart patterns — on a field of 127 videos rather than 498.
The corpus carries description text for only 10 of those 127, which is far too few to say anything about how the topic is written, so this page does not try.
When it fails
Another line is just as honest

This is the real weakness and it has no fix. A slightly different pair of lows gives a slightly different line, and that one has not broken yet.
The only defence is procedural: draw the line before you have a position, write down which lows you used, and notice when you are choosing a new pair because the old line stopped agreeing with you.
You redrew it to stay in
The specific version of the above that costs money. If the line moved and the market did not, you were negotiating.
You shorted the break
Covered above and worth repeating because it is the common one. The end of an uptrend is a range far more often than it is a downtrend.
You found the line afterwards

Every trend line that worked is obvious once the trend has run. Cover the right-hand side and there are several lines you could have drawn, all of them reasonable.
Related
Swing highs and lows is the page underneath this one — a trend line joins swing points, so which turns count decides the line.
Support and resistance is the horizontal version, and the wick-versus- close rule is the same on both.
And liquidity explains why a line everyone drew is the line price goes hunting.
The rule I use is that a break is a candle closing beyond the line and then the following candle going the same way. Trend lines get broken by wicks constantly, and if you act on the wick you spend your time being stopped out of trends that are still intact. The other thing I have made peace with is that if I redraw a line to keep a position alive, I have stopped analysing and started negotiating - and I know which one that is by whether I moved the line or the market did.
— Michael Whitman, from this video
This page is educational, not financial advice. Test every idea on your own charts before risking money.