How Do You Spot a Reversal?

A reversal is confirmed when an uptrend closes below its last higher low and then fails to make a new high, or the mirror of that in a downtrend. Before both of those have happened, what you are looking at is a pullback.
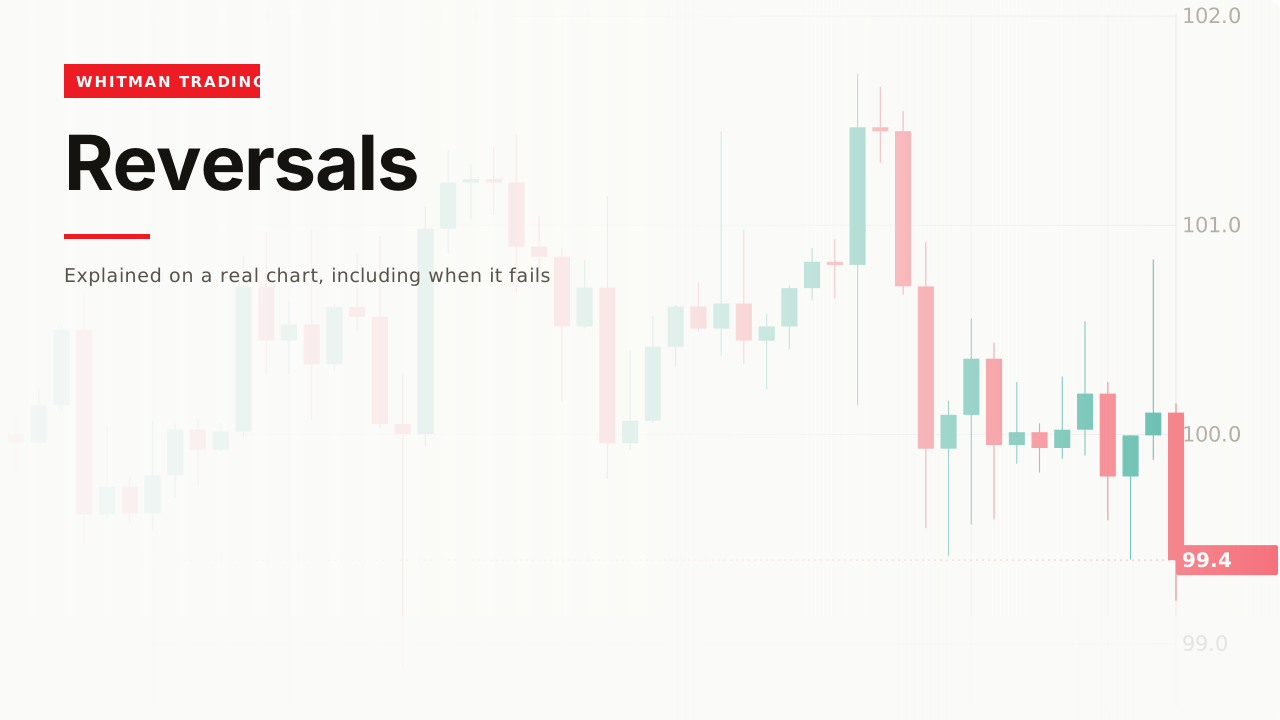
Almost every losing trade in a trend is someone deciding a pullback was a reversal. The difference is two specific events, in a specific order.
How it works

An uptrend is a sequence of higher lows. On this chart: 99.60, 100.03, 100.06.
The first event is a close below the most recent one. Price closed at 99.95, under 100.06, and the sequence that defined the trend is broken.

The second event is a lower high. Price came back to 100.71 against the previous high of 101.04 and turned down again.
Both, in that order. One without the other is not a reversal.
Why one is not enough

Six lower lows inside a single advance, using a fixed rule for what counts as a swing low.
Every one of them broke the sequence momentarily, and the trend continued. So a lower low on its own has an unimpressive record, and the second condition exists precisely to filter those.
The lower high is what makes it structural. A market that breaks a low and then makes a new high has done nothing; a market that breaks a low and then cannot get back up has changed.
Where a pullback ends

A pullback and a reversal are the same picture for most of their length.
The level at 100.03 held and the one at 100.06 did not, and until each of them was tested there was nothing on the chart distinguishing them.
Which is why the level has to be named in advance. “Below here, this stops being a pullback” is a sentence you can write before anything happens; “that looks like a reversal” is not.
What confirmation costs

Twenty bars, on this chart.
That gap is the price of the second condition. By the time both events have happened, a substantial part of the move down has already occurred, and there is no version of this that confirms sooner and stays reliable — the Supertrend and moving average pages reach the same trade-off from a different direction.
The honest framing: you are not trying to catch the top. You are trying to stop being wrong about the trend, which is a smaller and much more achievable goal.
Sharp and slow reversals are different problems
Worth separating, because the two-condition rule handles one of them much better than the other.
A sharp reversal turns and goes. The high, a fast break of the last higher low, a feeble rally, and away. The two conditions arrive close together and the confirmation is expensive in price but quick in time.
A slow reversal rolls over. The market makes a marginally lower high, drifts, breaks the low, comes back almost to the high, breaks again. The conditions are met, then almost unmet, then met again, and each cycle looks like the trend resuming.
The rule survives both and feels much worse in the second. In a rolling top you will call the reversal, get shaken out by the rally, and call it again — which is not a failure of the rule so much as the market genuinely not having decided.
The practical response is to widen the timeframe, not to loosen the rule. A rolling top on one chart is often a single clean sequence on the chart above it, and the same two conditions read cleanly there.
A worked example
Mark the last higher low while the trend is still working. That is the level, and it exists before any of this is in question.
Price closes below it. Note it. Do nothing — one condition of two.
Price rallies. Now watch the previous high. If it exceeds it, the trend was never broken and the close below was a deep pullback.
If it turns below it, both conditions are met. Now it is a reversal, and the invalidation for anything you do next is a close back above that lower high.
The original data
Across our study of 24,971 trading videos, 111 cover reversals. The median one gets 8,860 views, 70% never pass 50,000, and the median length is 10.9 minutes.
The corpus carries description text for 51 of those 111, and across those 51, three mention invalidation, failure, or what a bad read looks like.
Three out of fifty-one, on a topic where the entire difficulty is that most apparent reversals are not reversals.
When it fails
A lower low that goes nowhere

The signal fired and the market went the other way.
This is the ordinary outcome of acting on one condition, and there were six opportunities to make that mistake in a single uptrend on this data.
The lower high never comes
A market can break its last higher low and then simply grind sideways, making neither a new high nor a lower high for weeks. That is not a reversal and it is not a trend — it is a trading range, and the framework on this page gives you no answer for it, which is the honest limit.
You changed which low you were watching
If the level moved, you moved it. The same failure the trend lines page describes: picking a different swing low after price approached the first one is not analysis.
You called it before both conditions

At the break there is exactly one condition met, and this page’s whole content is that one is not enough. Every completed reversal looks obvious from the right-hand side, and so does every failed one.
Related
Market structure is the sequence a reversal breaks, and where the two conditions come from.
Pullback is the thing a reversal is being distinguished from, most of the time successfully.
And swing highs and lows decides which turns count as the levels, which is the judgment underneath both conditions.
This is the trade I have got wrong more than any other, and the pattern of the error is always the same - I decided it was a reversal at the point where it was still a pullback. What fixed it was refusing to use the word until both things had happened, which means I am late to every real one. I have made my peace with that, because the alternative is being early to every fake one, and I know from experience which of those costs more.
— Michael Whitman, from this video
This page is educational, not financial advice. Test every idea on your own charts before risking money.