What Is Support and Resistance?

Support and resistance are prices where the market has stopped and turned before. Support sits below price and resistance above it. Both are bands rather than exact lines, and once a level breaks it tends to swap roles: broken resistance becomes support.
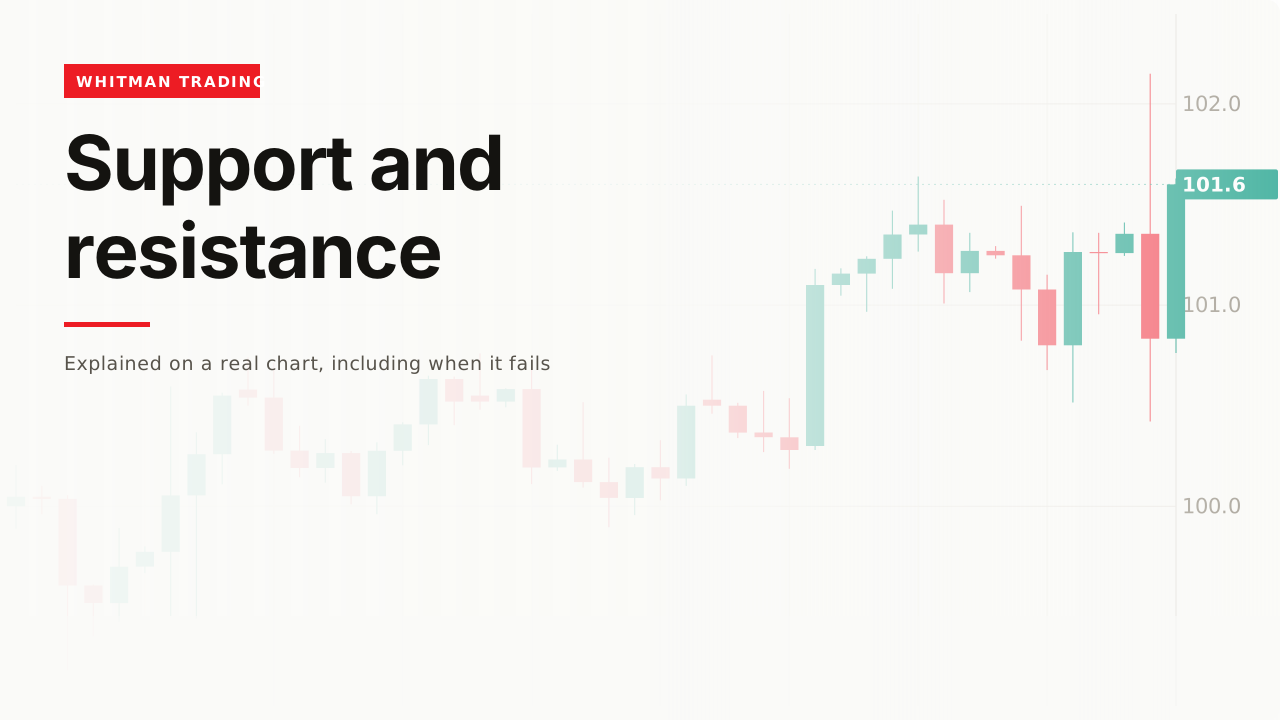
This is the first idea most people learn and the one most often drawn badly. The concept takes a minute. Using it well takes three corrections, and they are the whole of this page.
How it forms
A level is a price where the market has stopped before. That is the entire definition. Support sits below price, resistance above it, and they are the same thing seen from opposite sides.

The mechanism is memory. People who sold near that price watch it come back and sell again; people who bought and got trapped there wait to get out at breakeven. The level works because everyone can see where it is, which is also why the clean, obvious ones matter more than the clever ones.
It helps to know what is physically sitting there. Two different kinds of order collect at a level, and they pull in opposite directions.
Limit orders sit at the level and defend it. Someone who wants to buy at a hundred places an order that waits there. Enough of those and price cannot get through — that is support holding.
Stop orders sit just past it and attack it. Someone already long has a stop below, which is a sell order that fires automatically. Enough of those and a small break turns into a fast one, because each stop that triggers pushes price further into the next.
So a level is two crowds facing each other at the same price. Which one is bigger is not something the chart tells you — and that is the honest reason no level can be called in advance.
One stop is an event. Two stops at the same price is a level.
Correction one: it is a band

Real touches never land at the same price to the cent. Draw a line through the exact high and you will be stopped out by touches that were, in every meaningful sense, the same level.
Think in ranges. Not “one hundred” but “a hundred to a hundred and one, somewhere in that zone.” It sounds imprecise and it is the more accurate description of what is actually there.
Correction two: the flip
Once a level breaks, it tends to work in the opposite direction.

Everyone who wanted to sell there has sold. What is left is a crowd who watched it break and want to buy the pullback. This flip is the most dependable behaviour on the whole idea, and it is where most level-based entries actually come from.
Correction three: each touch spends it

This is backwards from what most people assume. A level touched four times feels proven, but each test consumes some of the orders that made it work. By the fourth visit much of what was there is gone.
That does not make a well-tested level worthless. It means a level’s strength is not the number of touches — it is how much is still resting there, and touches subtract from that.
Two things worth checking
How long has it been there. A level that has held for five months is different from one that formed this morning, and it is a thing you can count rather than judge.
Which timeframe you drew it on. A level from the daily chart holds more than a level from the five-minute, for the plain reason that more people looked at it. Draw levels on the timeframe above the one you trade, then drop down to time the entry — the levels stay put while you do.
Is it a round number. Prices ending in a lot of zeros act as levels because people type round numbers into orders, not because anything technical happens there.

A wick through is not a break

Price traded above the level and closed back below it. A wick beyond a level is the level being tested and holding — often the opposite of a break. Waiting for a close costs a few points and removes a category of bad entries entirely.
A worked example
The first touch. Price rallies, stalls, turns. Nothing to do; one high is not a level.
The second touch. Price returns to nearly the same price and turns again. Now you have a band, and you can draw it across both touches rather than through either one.
The third touch. It holds again, but weaker — and this is the point where most people are most confident and the level is least strong.
The break. A candle closes clearly above the band. Not the entry. A break on its own tells you the level is gone, not that anything is coming back.
The retest. Price returns to the band from above and holds. That is the entry, and the reason is specific: the band now has buyers under it instead of sellers over it.

The original data
Across our study of 24,971 trading videos, 389 cover support and resistance. The median one gets 18,609 views, 63% never pass 50,000, and the median length is 12.9 minutes.
That median is higher than smart money concepts, order blocks or fair value gaps — the oldest idea on a chart still out-draws the vocabulary built on top of it. The oldest idea on a chart still draws the most people.
The corpus carries description text for 124 of those 389, and across those 124, seven mention invalidation, failure, or what a bad read looks like.
When it fails
It breaks and never comes back

The retest is a habit, not a rule. Plenty of breaks simply leave, and a plan that only works with a retest has no answer for them.
The day nothing holds

On a genuinely bad day, everything breaks together. Levels are a claim about ordinary conditions — that orders resting somewhere will slow price down. When a whole market is selling at once, that assumption is simply false, and the levels tell you nothing.
Knowing which kind of day you are in matters more than where you drew the line.
You drew it afterwards

Scrolling back to find the level that worked takes seconds and feels like analysis. The honest test is whether you would draw the same band with the right-hand side of the chart covered.
Related
Market structure is the next step, because a level only matters in the context of which way the highs and lows are already going.
An order block is a more precise version of the same instinct — a band drawn from one specific candle rather than from a run of touches.
And smart money concepts is largely this idea with newer names, which is worth knowing before you pay anyone to teach it to you.
Two habits, and I did not pick either of them up from a book. I think in ranges rather than prices - not ’thirty thousand’ but ’thirty to thirty-two thousand, somewhere in that zone.’ And I always check how long the level has been there before I trust it, because five months of a level holding is real information and this morning’s level is not. The other thing I have watched happen enough times to stop arguing with it: on a genuinely bad day, everything breaks together and none of the levels matter.
— Michael Whitman, from this video
This page is educational, not financial advice. Test every idea on your own charts before risking money.