What Are Swing Highs and Swing Lows?

A swing high is a candle whose high is higher than the candles on both sides of it. A swing low is the mirror — a candle whose low is lower than its neighbours. They are the turning points that market structure, trend lines and most stop placements are built from.
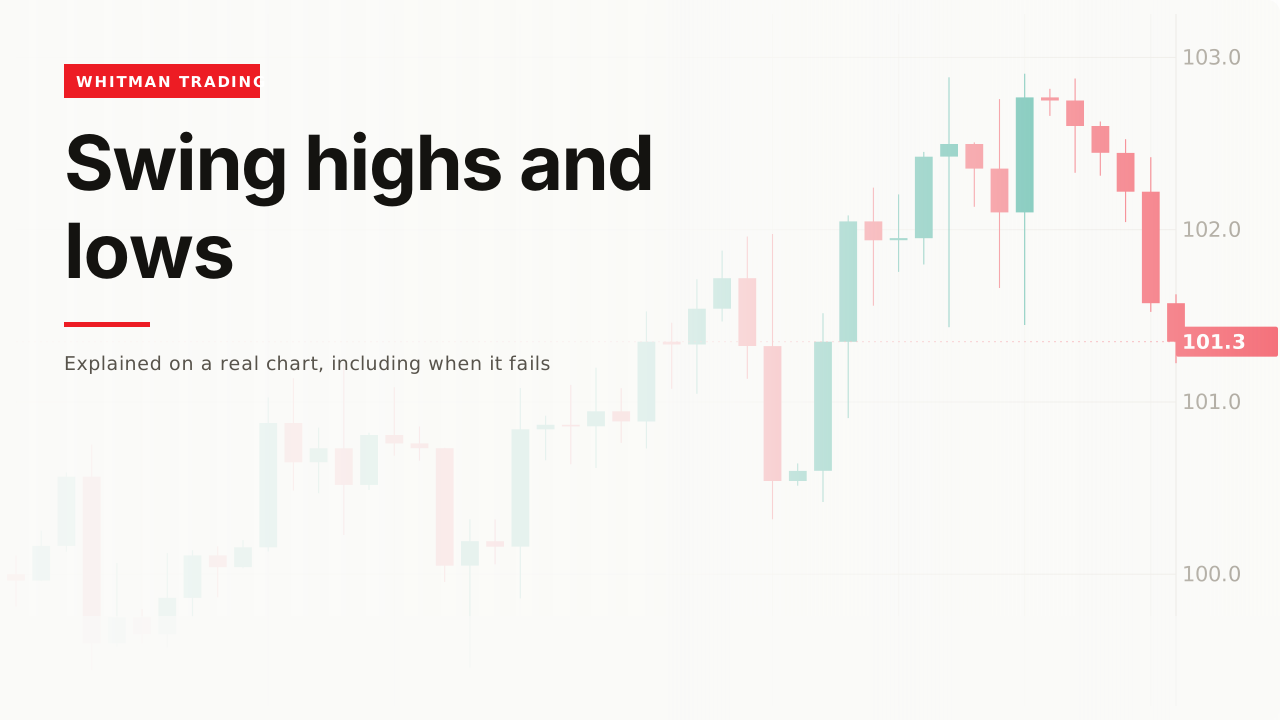
Almost every other idea on this site is built from these, and they are rarely defined anywhere. Two sentences of definition, then the three things that actually matter about them.
How it forms
A swing high is a candle whose high is higher than the candles either side of it.

A swing low is the mirror: a candle whose low is lower than its neighbours on both sides.

That is the whole definition. Some tools require two or three candles either side rather than one, which produces fewer and larger swings — the number is a setting, not a law.
What the setting actually does
Every tool that marks these has a number: how many candles either side must be lower. It is usually labelled length, strength or period, and it is the only setting that exists.
One candle either side finds dozens of swings. Most are noise, and the chart fills up.
Five candles either side finds a handful. Those are the turns you would have pointed at anyway.
The cost is on the other side of the trade: a bigger number confirms later. A five-bar swing high cannot be known until five candles after the peak, so a cleaner chart is also a slower one. There is no setting that gives you both, and choosing one is choosing which mistake you prefer.
What a swing point actually is
Worth a sentence of mechanism, because it stops these feeling like arbitrary marks.
A swing high is where buying ran out. Price rose while buyers kept paying more, and at that candle they stopped — either they were finished, or sellers arrived in enough size to end it.
That is why the level matters afterwards. Everyone who sold there watches it, and everyone who bought just before it is waiting to get out at breakeven. The liquidity page has the rest of that story.
The part that catches everyone
A swing high is not a swing high when it prints. It becomes one later.


Every swing point is confirmed late, by definition, because the definition requires candles that have not happened yet. There is no setting that fixes this and no tool that sees it sooner.
Which means anything built on swing points — structure, trend lines, most stops — is also confirmed late. That is not a flaw in the idea. It is worth knowing so you do not go looking for the version that arrives on time.
Which ones are worth marking

Technically, a chart contains dozens. Practically, most are noise.
The test: did price turn there and go somewhere? If the high was exceeded two candles later, it was a pause, not a turn. The other test is the one on the timeframes page — if it vanishes when you combine candles, it was never a swing.

What they are for
They are market structure

Market structure is swing points joined up. “Higher highs and higher lows” is a sentence about swing highs and swing lows and nothing else, which is why this page comes first.
They tell you where the stop does not go

A stop goes beyond a swing, never on it. The swing low is the obvious price, which means it is where everyone else’s stop already sits — the liquidity page covers what happens to obvious prices.
A worked example
Price falls, turns, and rises. At the turn you have a candidate low and nothing else.
Three candles pass without a lower low. Now it qualifies. You are three candles late and there is no version of this where you are not.
Price rises and turns again. Another candidate, confirmed the same way.
You now have two points. A low and a high — still not a trend, just a move.
Price falls and stops above the first low. This is the moment the chart says something: a higher low, which is the first evidence of a sequence rather than a wiggle.
And your stop has a home. Below that higher low, because that is the price at which the sequence you just identified stops being true.
The original data
Across our study of 24,971 trading videos, only 6 name swing highs or swing lows in the title.
Six. And their median is 36,491 views, against 11,938 for pullbacks and 5,358 for breakouts. Their median length is 27.7 minutes — more than double the typical trading video.
Six is far too small a sample to conclude anything about how well the topic performs, and this page will not pretend otherwise. What it does show is that the building block underneath market structure, trend lines and stop placement is essentially never the subject of a video — it gets used everywhere and explained almost nowhere.
When it fails
The swing gives way

A swing low holding is what a trend is. A swing low breaking is the trend ending, and that is the event every stop on this site is placed against.
You marked thirty of them
A chart with a mark on every turn is a chart you cannot read, and it will always contain a swing point supporting whatever you already wanted to do.
You are waiting for confirmation that cannot come early
Covered above and worth repeating, because it is where beginners look for a fix that does not exist. The lateness is the definition.
You found it afterwards

Every swing point is obvious with the right-hand side of the chart visible. At the candle itself it is a guess, and it stays a guess for several more candles.
Related
Market structure is the next page — swing points joined up are what a trend is made of.
Pullback is what happens between two swing points, and its higher-low test is this page applied in sequence.
And risk management is where a swing low turns into a stop and a position size.
I do not use the swing-point setting on indicators, and that is a deliberate choice rather than laziness. When I turn it on it marks every high and low it can find and clutters the screen, and I already trust the levels I have drawn from order blocks more than I trust a label the tool put there. The turning points that matter are usually the ones you would have pointed at anyway - if you need software to tell you a swing high happened, it probably was not a big enough one to trade around.
— Michael Whitman, from this video
This page is educational, not financial advice. Test every idea on your own charts before risking money.