What Is a Trading Range?

A trading range is price moving sideways between a ceiling it keeps failing to break and a floor it keeps failing to fall through. It is not a trend and it is not a pause before one — it is a state in its own right, and most indicators behave badly in it.
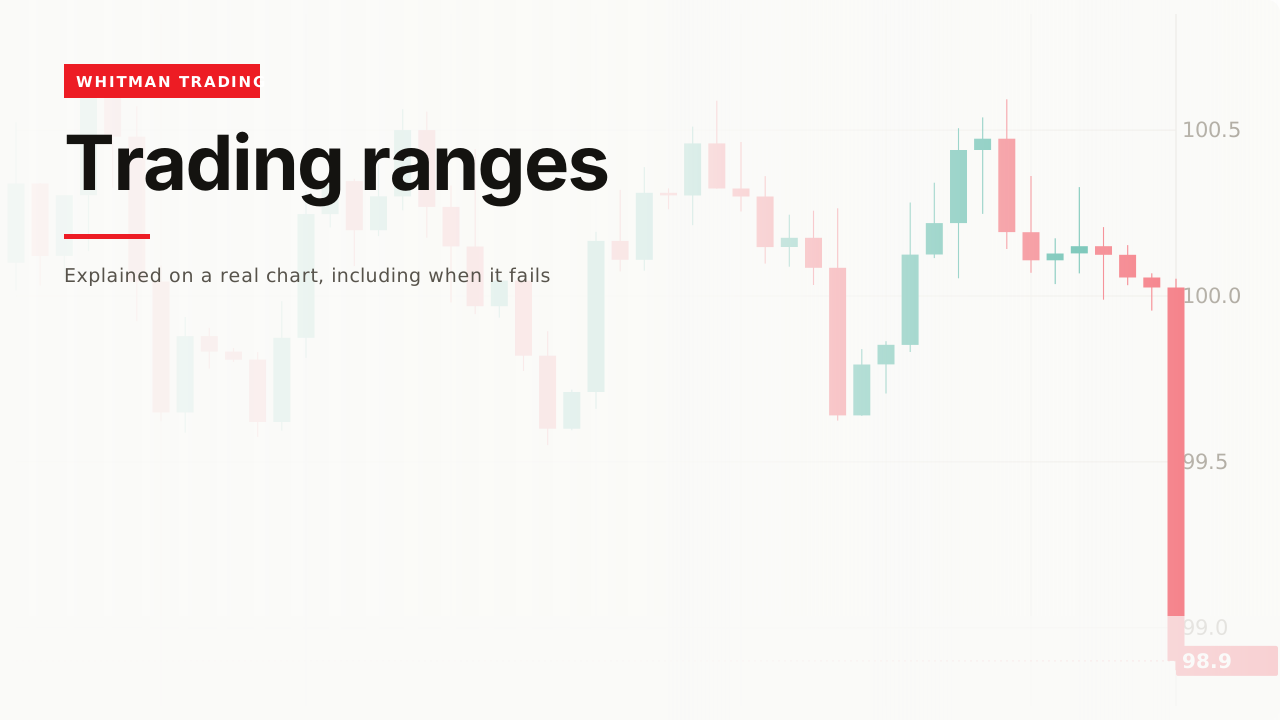
Markets spend a great deal of their time going nowhere, and going nowhere is a specific condition with its own rules — not a broken trend or a waiting room.
How it forms
A range is a ceiling and a floor.

It forms for an ordinary reason: buyers and sellers keep changing places at the same two prices. Sellers show up at the top and buyers at the bottom, and neither group is big enough to end it.

Two touches make a line, several make a range. Before that you have a chart that happens to be flat, which is not the same thing.
Where the trade is

At an edge you can answer the only question that matters: where am I wrong? A little beyond the floor, or a little beyond the ceiling. Both are specific and both are close.

In the middle there is no answer. You are the same distance from being proved right and proved wrong, so the stop has nowhere to go and the position cannot be sized. That is why the middle costs people money — not because it is unlucky, but because the trade cannot be defined there.
Telling one from a trend, early
The test is the same one on the market structure page, asked backwards.
A trend makes higher highs and higher lows, or lower highs and lower lows. A range makes highs at roughly the same price and lows at roughly the same price. So the question is not “does this feel sideways” — it is whether the last two highs are level or stepping.
The honest part: you usually cannot tell for the first few touches. A range and the early part of a trend look identical, and a trend that pauses looks exactly like a range beginning. That is not a skill problem; there is genuinely not enough information yet.
A pullback is a range, one timeframe down
Worth knowing because it connects two things that look separate.
When a trend pauses sideways, that pause is a small range on the chart you are watching — and on a lower timeframe it is a full-sized one with its own ceiling and floor.
Which means a pullback can be traded as a range, and a range inside a trend tends to break in the direction the trend was already going. That is the one case where the two edges are not equally likely, and it is the most useful thing on this page.
The height is the trade

Measure the range before you take anything in it. The distance from floor to ceiling is the entire move available, and if it is not much bigger than the stop you need, the trade is not worth taking regardless of how good the entry looks.
That is a decision you can make in ten seconds, before any of the emotional part starts.
Why indicators struggle here

This is not a criticism of the tools, it is their definition. A moving average reports where price has been centred; in a range it has been centred in the middle, so the averages sit on top of each other and cross on noise.
Every one of those crossings is a signal by the standard reading, and none of them started anything. The same is true of MACD, and the extremes on RSI are the one case that works better here than in a trend.
A worked example
Price touches the same ceiling three times and the same floor three times. Now you have a range rather than a flat stretch.
You measure it. Floor to ceiling. If that distance is not several times the stop you would need, you are done — no trade, and it cost nothing to find out.
Price returns to the floor. This is the entry, and the reason is not a pattern: it is that the floor is the only place where being wrong is cheap.

The target is the other edge, not a number you picked. The range told you where the move ends, which is unusual and worth using.
The original data
Across our study of 24,971 trading videos, 18 cover ranges, consolidation or sideways markets. The median one gets 17,798 views, and the median length is 11.6 minutes.
Eighteen is a small sample and this page will not lean on it. But it is worth setting beside the 468 videos on breakouts, which have a median of 5,358: the event that ends a range is covered twenty-six times more often than the range itself, despite the range being the state markets are in far more of the time.
When it fails
The edge does not hold

The floor gets undercut, your stop goes, and price closes back inside the range. This is the ordinary cost of trading edges and it is why the stop sits beyond the level rather than on it — the liquidity page explains why the obvious price is the crowded one.
The range ends

Every range ends and none of them announce it. The same trade that worked at the floor four times is the trade that is open when the floor finally gives. Being right repeatedly is what sets that up.
When a range breaks one way and then reverses hard the other, that three-part shape has a name: the market maker model. It is worth knowing as a pattern, whatever you make of the name.
You decided it was a range after two touches

Two touches is the minimum evidence and it is thin. A range is obvious on the fifth touch and by then it is often nearly over.
Related
Support and resistance is what the two edges are — the range is just two of them facing each other.
Breakout is how a range ends, and the page covers why the break so often fails the first time.
And market structure is the test that tells you a range from a trend before you commit to either.
The thing I have to talk myself out of most often is doing something in the middle of a range. There is always a reason to - it looks like it is moving, an indicator has just crossed, something is happening. But in the middle there is no level nearby, which means there is nowhere sensible to put a stop, which means I cannot tell you how much the trade can cost. If I cannot answer that in one sentence I do not have a trade, and in the middle of a range I never can.
— Michael Whitman, from this video
This page is educational, not financial advice. Test every idea on your own charts before risking money.