What Is a Breakout?

A breakout is price moving beyond a level that had been holding it in, and closing there. It matters because a level that contained price for a long time stops containing it, which usually means a faster move follows. A break that reverses straight back is called a false breakout.
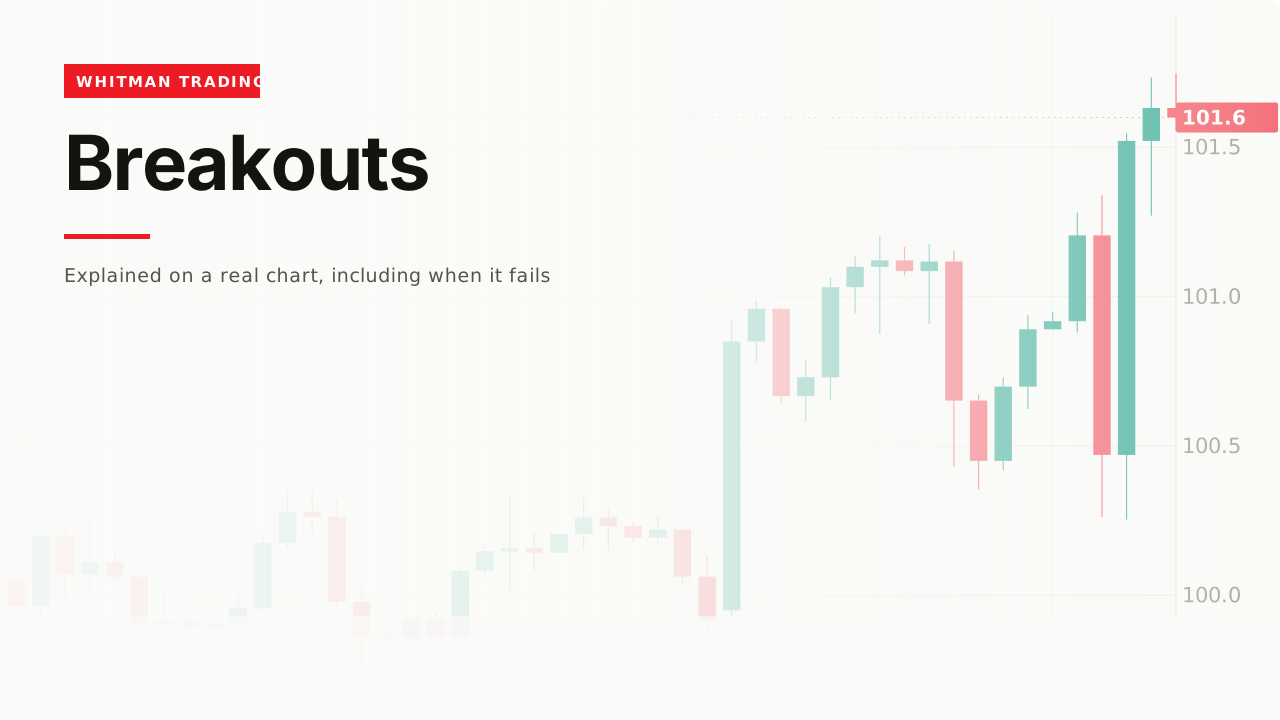
Breakouts are the most-taught entry in trading and among the worst-performing, and both of those facts come from the same place: the setup is easy to see and the failure is impossible to see coming.
How it works
The idea is not that a line has power. It is that a level accumulates orders on both sides, and breaking it sets two things off at once.
The sellers who were defending it are gone. They were the reason price kept stopping there. Once their orders are filled, the thing holding price back has been consumed.
And the stops on the other side fire. Everyone who was short from inside the range has a stop above it — which is a buy order. Enough of those trigger and each one pushes price into the next, which is why a break often moves faster than the range ever did.
Add the traders who were waiting for the break as their entry signal, and three separate groups are buying in the same few minutes.
That is the whole mechanism, and it explains the failure too: if there were not many orders resting up there, none of that happens and price simply drifts back. The liquidity page is the same argument from the other direction.
You need something to break out of

No range, no breakout. Price has to have been contained by something first — a level it kept stopping at, or a stretch of sideways movement with a clear top and bottom.

The tighter and longer the range, the cleaner the level — because more people have seen it and more orders are parked around it.
What counts as a break

A close beyond the level. Not a touch, not a spike.

That candle traded above the level and finished below it. A wick through is the level being tested and holding, which is nearer to the opposite of a break than a weak version of one.
The one confirmation available

Volume is the only independent evidence a chart offers, because it is the only thing on it not calculated from price.
A break on a bar much larger than its neighbours means a lot of people transacted at that price. A break on a quiet bar means the level was crossed because nobody was defending it that minute.
The volume page has the full version — why it is a comparison rather than a number, and why a big bar still does not tell you which side won.
The retest

Price often comes back to the broken level and holds on it from above. Everyone who wanted to sell there has sold; what is left is people who watched it break and want in on the pullback.
That is usually the better entry, and it is the same flip described on the support and resistance page.

But plenty of breakouts never give you one. A plan that only works with a retest has no answer for the ones that leave, and those are often the strongest moves.
A worked example
The range forms. Four touches of the same ceiling over a stretch of quiet trading. You mark the top and the bottom and do nothing.
A candle closes above the top. Still not an entry, by the rule at the top of this page — one close is a claim, not evidence.
The next candle goes the same way. Now the break has been confirmed by something other than itself.
Price returns to the level and holds. This is where the trade goes on.

The stop goes back inside the range, not just under the level. If price is inside the range again, the breakout did not happen — that is the cleanest definition of wrong this setup offers, and you can mark it before you enter.
The original data
Across our study of 24,971 trading videos, 468 cover breakouts. The median one gets 5,358 views, 78% never pass 50,000, and the median length is 12.6 minutes.
That median is low — below pullbacks at 11,938 and well below support and resistance at 18,609. The likeliest reason is saturation: 468 videos on a setup whose explanation is four sentences long.
The corpus carries description text for 113 of those 468, and across those 113, two mention invalidation, failure, or what a bad read looks like. Two, on the setup with the most famous failure mode in trading.
When it fails
The false breakout

That is a textbook break — a clean close beyond the level, exactly what the rule asks for — and it failed. Nothing distinguished it at the close.
There is a reason it happens so often, and it is the liquidity argument: the obvious level is where the orders are, so it is precisely the price a large buyer or seller has a reason to push through and then abandon.
You entered on the poke
Covered above. The wick-through is the single most common way to lose money on this setup, and waiting for the close removes an entire category of it at the cost of a few points.
There was no range
Price drifting up and making a new high is not a breakout, because nothing was containing it. The word only means something relative to a level that had been holding.
You found it afterwards

Every real breakout is obvious afterwards, and so is every false one. At the candle itself they are the same picture.
Related
Support and resistance is the page underneath this one — the level has to exist before anything can break it.
Volume is the only confirmation available, and the page explains why a big bar is not the same as a bullish one.
And risk management is what turns “back inside the range” into a position size you can actually hold.
My rule is a candle closing beyond the level and then the following candle going the same way. Not a wick through it - an actual close, and then confirmation. That costs me a bit of the move every time and I have made my peace with it, because the trades that used to cost me most were the ones I took on the poke. I have also watched a squeeze break out live on a stream and then fail within minutes, which is the honest version of what this setup is: a good idea with a failure mode that shows up often enough to plan around.
— Michael Whitman, from this video
This page is educational, not financial advice. Test every idea on your own charts before risking money.