What Is Liquidity in Trading?

Liquidity is the pool of resting orders sitting at prices everyone can see — mostly stop losses, clustered above obvious highs and below obvious lows. It explains why price runs to a level, takes it, and turns around instead of continuing.
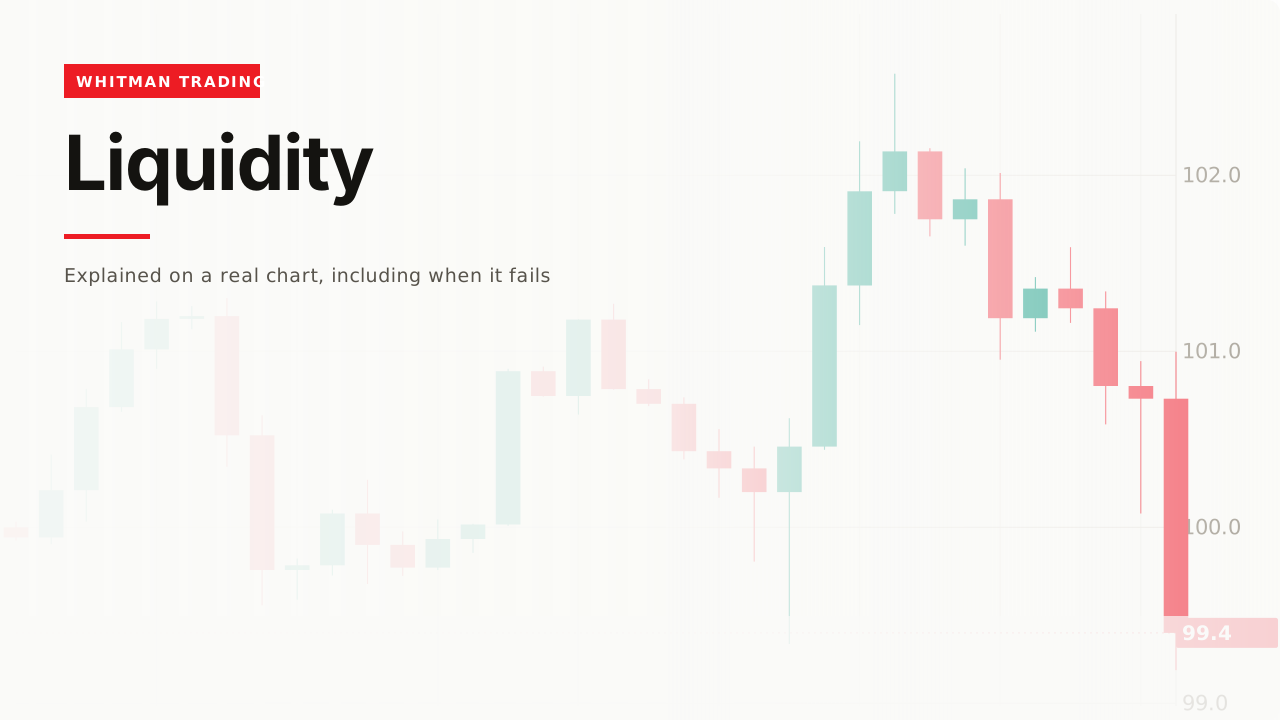
If you have ever watched price run precisely to an obvious level, take it by a few points, and then reverse hard — this is the explanation.
How it works
Liquidity is resting orders. Orders that have been placed and are waiting at a price, mostly stop losses.
Every trader who is short from a high has a stop above that high. Every trader long from a low has a stop below it. Those stops are not opinions — they are live orders sitting at known prices.

A large buyer needs sellers to buy from. A cluster of stop-loss orders above a high is a cluster of sellers, at a known price, at a known moment. That is why price goes there.
It helps to be concrete about what a stop loss actually is. If you are short from 101.20 and you set a stop at 101.25, you have placed a buy order at 101.25 that fires automatically. You think of it as protection. Mechanically it is a resting buy order at a known price.
Now multiply that by everyone who shorted the same obvious high. That is not a crowd of opinions — it is a stack of buy orders, and the only way to reach them is to move price up to where they sit.
This is worth understanding even if you never trade it, because it reframes what a level is.
A level is not a wall that holds or breaks. It is a place where orders piled up because it was easy to see. That accumulation is the whole story, and it explains behaviour that otherwise feels like the market targeting you personally.
It is not personal. It is just that you put your order in the same place everyone else did.
Equal highs are the clearest example
One high is a level. Two highs at nearly the same price is a pool, because the second one makes it obvious to everybody.

The more obvious a level looks, the more orders sit behind it. Obviousness is the mechanism, not a coincidence. A level nobody notices has nothing resting at it.
That has a consequence worth naming: a small, tidy, very obvious level sitting just in front of a bigger one will be reached first. Inducement is the word for that, and it explains a lot of stops that get hit shortly before a level works.
That inverts a common instinct. A beginner is taught to look for the cleanest, most obvious levels — and that instinct is correct, but not for the reason usually given. The clean level is not respected because it is technically significant. It is significant because it is clean enough that everyone put an order behind it.
The sweep
A sweep is price taking the pool and then reversing.

The sequence is always the same: run to the obvious level, take the orders resting there, then move in the other direction — often faster than it arrived.
It works below, too
Same idea, inverted. Equal lows are where long stops sit.

If you only look above highs, you will miss half of these — the same problem as marking only bullish order blocks.
Your stop is part of the pool
This is the uncomfortable half, and the useful one.

If you place your stop just above an obvious high because it feels safe, you have placed it exactly where the orders are. It feels safe because it is obvious, and obvious is the problem.
The fix is not to trade without stops. It is to accept that a stop placed at the obvious level is part of what the market is aiming at, and to place it beyond the sweep — accepting a wider stop, or taking a smaller position.
A trendline is a pool too
Everyone drew the same line, so everyone’s stop is under it.

Trendline breaks fail often, and this is why. The break is frequently the point of the move rather than the start of one.
A worked example
Read the sweep chart the way you would at the time.
The first high. Price rallies, stalls, pulls back. One level. Nothing to act on, and nothing obvious about it yet.
The second high. Price returns to almost exactly the same price and stalls again. Now it is visible to everyone — including everyone who just went short expecting the level to hold, all of whom now have a stop a few points above it.
The push through. Price takes both highs. Anyone short is stopped out, which means their stop becomes a buy order, which pushes price higher still. That is the moment the pool is consumed.
The reversal. With the orders gone, nothing is left to push price up, and it turns.
The entry, if you take one: not at the sweep — you cannot know it is a sweep yet. The entry is when price closes back below the level it just took. That close is the first evidence the move was a sweep rather than a break.

The original data
Across our study of 24,971 trading videos, 480 cover liquidity. The median one gets 12,312 views, 65% never pass 50,000, and the median length is 14.9 minutes.
The corpus carries description text for 196 of those 480, and across those 196, four mention invalidation, failure, or what a bad read looks like.
Small window, and a hint rather than a census. But four in 196 is roughly two percent, on an idea whose entire practical value is knowing when it has not happened.
When it fails
It was a break, not a sweep
The identical move that keeps going is not a sweep. It is a breakout, and you are now short into one.

Nothing distinguishes the two at the moment the level is taken. The distinction only exists afterwards, which is why the entry waits for the close back inside.
It was swept and nothing happened
Price takes the level and then does nothing at all.

This is common and rarely taught. It means the pool was small, or was already filled by earlier activity. A level being obvious does not guarantee that anything is resting at it.
You called it in hindsight
Every sweep is clear afterwards. Here is the same chart, stopped at the moment of the sweep:

If you cannot tell from this, you cannot tell in the moment either. That is not a skill problem; it is the actual state of the information.
Related
Liquidity explains why price returns to a level. Market structure tells you whether that return matters.
An order block is how you mark the level price is likely to return to.
And the fair value gap left behind by a fast move is often the reason it comes back at all.
The liquidity traps are much harder to spot than the textbook version suggests. I do not take one on its own - I want other technicals agreeing before I act on it, because the same candle that looks like a trap in hindsight looks like a breakout at the time.
— Michael Whitman, from this video
This page is educational, not financial advice. Test every idea on your own charts before risking money.