What Is the Supertrend Indicator?

Supertrend is a single line placed a multiple of ATR away from the midpoint of each bar, which ratchets toward price and never back away. When price closes through it the line flips to the other side of price and changes colour, and that flip is the indicator's entire output.
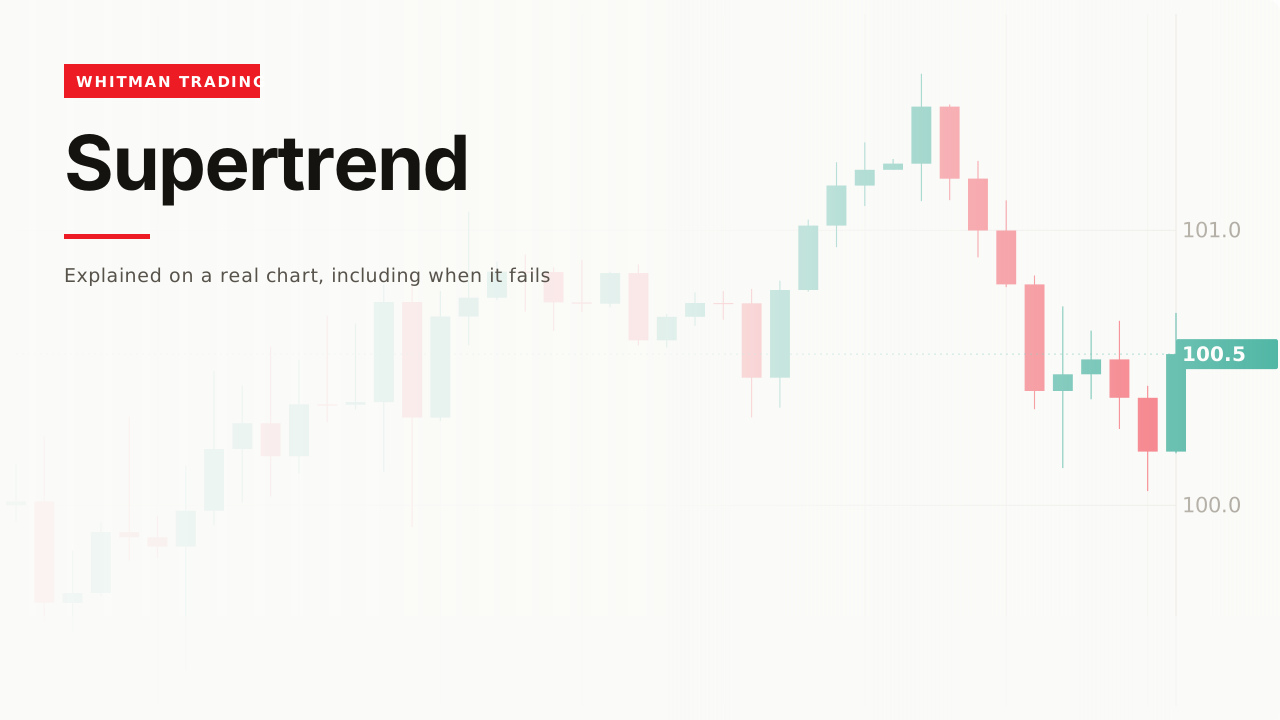
One line, two colours, and a reputation for whipsawing that the numbers on this page only partly support. It is worth knowing what it is made of before deciding either way.
How it works

Two steps and no third one.
Take a multiple of ATR from the midpoint of each bar. The default is 3 × ATR(10), which on the last bar of this chart is 1.10.
Then ratchet it. While price stays above, the lower band can move up but never back down. When price closes through it, the line jumps to the other side and the colour changes.

The ratchet is why the drawn distance is not 3 ATR. It starts there and tightens — on this bar it has closed to 0.85 against a starting 1.10. That one-way movement is the whole reason it works as a trailing stop.
Its entire output is the flip

Measured on this trend: one flip across 42 bars.
That is not an undersell — it genuinely produces one bit of information per stretch of market, and everything else you might read into it is you looking at the price chart underneath.

In a trend it simply trails, which is the job it is good at: staying in something rather than finding something.
The whipsaw reputation, measured

Everyone will tell you it whipsaws in a range. Across 300 test seeds of the choppy scene above, the default 10 / 3 gave a median of 1 flip. Widening the range to nearly twice the size did not change that.
The reason is in the construction. The band is 3 × ATR, and ATR grows when the chop grows — so a wilder range pushes the line further away at exactly the moment it would otherwise be crossed. Supertrend normalises itself.
The whipsawing belongs to lower factors. On the chart above: 3 flips at factor 3 and 8 at factor 1.5, identical bars. So the complaint is real, and it is a complaint about a setting rather than about the indicator.
The settings

Two numbers: the ATR length and the multiplier.
The multiplier is the one that matters and it trades the same thing every trailing stop trades — tighter means out sooner and out wrongly more often; wider means more given back at the end.
Choosing it by counting signals is choosing the answer. If you lower it until the chart shows more trades, you have not made the indicator better, you have made it noisier and confirmed nothing.
The flip is decided on the close
Worth its own section, because it is where people lose money on an otherwise well-behaved tool.
The condition is a close through the line, not a touch. A wick that pierces it and comes back leaves the line exactly where it was — the same rule as every level on this site, and here it is written into the formula rather than left to judgment.
Which means the current bar is not final. While a bar is still forming, the line can sit on one side, flip, and flip back before the bar closes. On a chart you are watching live, the colour you are looking at is a provisional colour.
The practical rule is to act on closed bars only. If you take the flip the moment you see it, you will regularly take a flip that never actually happened, and then wonder why the historical chart does not show the trade you remember making.
A worked example
You already have a position from your own read — Supertrend is not what got you in.
The line is below price and green. Nothing to do. That is what it says for most of a trend.
Price pulls back and does not close through the line. Still nothing to do, and this is where the tool earns its keep: it gives you a reason not to act.
Price closes through and it flips. Out, and note what just happened — the flip is the exit signal, and there is nothing in it about going the other way.
It flipped 4 bars after the actual high on this chart, which is what you pay for a rule that holds through pullbacks.
The original data
Across our study of 24,971 trading videos, 140 cover Supertrend. The median one gets 17,345 views, 69% never pass 50,000, and the median length is 8.7 minutes.
That is a strong median for this glossary — above ATR at 10,863 and well above Bollinger Bands at 3,516 — on 140 videos, a small field.
The corpus carries description text for 64 of those 140, and across those 64, two mention invalidation, failure, or what a bad read looks like.
When it fails
It is late at both ends

Four bars, on this chart. The ratchet that lets it hold through a pullback is the same mechanism that makes it give back the end of the move.
You cannot have one without the other. A version that exits at the high would exit on every pullback too.
A flip is not a reversal
When it turns red it is saying the up-move is over. It is not saying a down-move has started — the same distinction as the trend line break on the trend lines page, and taking every flip as a two-way trade is how a range takes your money.
You lowered the factor to get more signals
Covered above with numbers: 8 flips instead of 3, same market. More signals from the same data is not more information.
You looked once it had trended

Every held trend looks like the indicator worked and every whipsaw looks like it failed — and at the moment of the pullback above, those two are the same picture.
Related
ATR is the measurement underneath this, and the reason the band widens when the market gets wild.
Moving average is the other way to get a trailing reference, and it bends rather than ratchets.
And trading range is the condition where the flips stop meaning anything, which you have to identify from price, not from the line.
What I like about it is that it makes one decision and then leaves you alone, which suits me because my worst habit is fiddling with a position that is working. What I would not do is take every flip as a trade, because in a market going nowhere those flips are just noise with a colour attached. It answers whether to stay in something. It is much weaker at telling you what to get into.
— Michael Whitman, from this video
This page is educational, not financial advice. Test every idea on your own charts before risking money.