What Is the Wyckoff Method?

The Wyckoff method describes a market moving through accumulation, markup, distribution and markdown. Within accumulation, a spring is a dip below the range low that is quickly reclaimed, followed by a test that holds higher, and then the move out of the range.
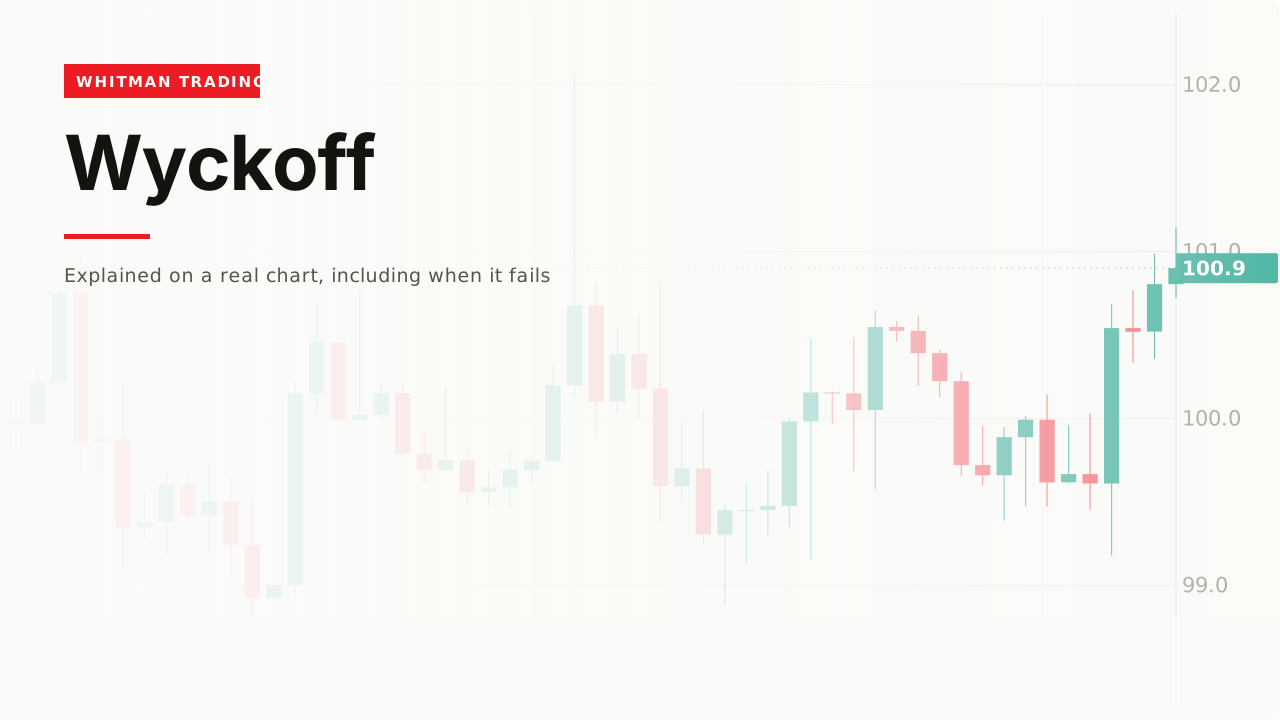
Richard Wyckoff was writing in the 1920s and 1930s, and the mechanism he described is the one this site keeps arriving at from other directions.
How it works

Four phases, in order:
Accumulation — a range, after a decline. Markup — the move out of it. Distribution — a range, after the advance. Markdown — the move down.
The claim underneath is about who is doing the buying. A range after a fall is where large buyers accumulate without moving price against themselves; the range after a rise is where they sell into strength.
That is an assertion about intent, and it is the part of the method that cannot be checked from a chart. What follows is the part that can.
The spring

A spring is a dip below the range low that price immediately reclaims. On this chart it went 0.31 below the floor of 99.19 and closed back inside.
The reasoning is mechanical rather than mystical. Stops from everyone who bought the range sit just under its floor. Reaching them fills sell orders — which is exactly what a large buyer needs, and exactly what the liquidity page describes.
The test

A test is a second visit toward the low that stops higher. Here price came back to 99.65, comfortably above the spring’s 98.88.
This is the confirmation and it is what separates a spring from a breakdown. The first dip proves nothing; the second one holding is the evidence that the supply below the range has gone.

Then markup, which is an ordinary breakout with a name.
It is the liquidity sweep

Same event, two vocabularies, ninety years apart.
The liquidity sweep page describes a push below an obvious low that reverses, on the reasoning that stops rest there. That is a spring.
Wyckoff’s version is the better-specified of the two, because it requires a test afterwards. The modern retelling frequently stops at the sweep, which is the half that can be seen in hindsight on any chart.
Volume is half of it

Wyckoff’s law of effort versus result compares volume with the price move it produced. Heavy volume and a small move means effort without result — someone was absorbing it.
A spring on heavy volume that closes back inside is the whole thesis in one bar. A spring on nothing is a small market drifting.
Most modern versions of this method drop the volume entirely and keep the shapes, which is removing the evidence and keeping the story.
The Composite Man
The device the whole method is explained through, and it is worth being clear about what kind of thing it is.
Wyckoff asked readers to imagine a single large operator — the Composite Man — who accumulates quietly, marks price up, distributes into the enthusiasm, and marks it down. Every phase is described as something he is doing.
He explicitly presented this as a device for thinking, not as a claim about a real person. The point was to stop reading a chart as weather and start reading it as the residue of somebody’s decisions.
That is genuinely useful and it is also the seed of the problem. A century later the device gets taken literally, and the same reasoning arrives on this site as the market maker model — where a single actor is not a thinking aid but an assertion.
The honest version of the idea does not need one operator. It needs only that a lot of stops rest under an obvious low, which is true whether one large buyer is exploiting them or thousands of small ones simply are them.
A worked example
Identify the range first, from price. Floor and ceiling, both written down.
Wait for a dip below the floor that closes back inside. Not a wick — a close, the same rule this site applies everywhere.
Check volume on that bar. Effort without result is the confirmation; a quiet spring is a suggestion.
Then wait for the test. A second dip that holds higher is the evidence. Acting on the spring without the test is acting on one of two conditions, which the reversals page counts the cost of.
The invalidation is a close below the spring low, which is a real price the pattern handed you.
The original data
Across our study of 24,971 trading videos, 187 cover Wyckoff. The median one gets 3,793 views, 82% never pass 50,000, and the median length is 15.5 minutes.
15.5 minutes is among the longest medians here, which fits a method with four phases and its own vocabulary.
The corpus carries description text for 157 of those 187 — a large sample — and across those 157, two mention invalidation, failure, or what a bad read looks like.
When it fails
The floor breaks and stays broken

A spring and a breakdown are the same bar until price closes back inside. On the chart above the floor gave way and nothing recovered it.
There is no version of the method that identifies this in advance, which is why the test exists.
The phase label is a guess about intent
Accumulation and distribution look identical — both are ranges. The difference is who was buying, which no chart shows.
So calling a range accumulation is a prediction wearing the clothes of an observation, and it is the single most common way this method is misused.
The volume half gets dropped
Covered above, and it is what turns the method into shapes. Without effort against result there is no evidence in it, only a story about a range.
You labelled the phases afterwards

Every completed accumulation is obvious. At the moment price sits below the floor, the spring and the breakdown are the same picture, and the method’s own answer — wait for the test — is the correct one and costs you the low.
Related
Liquidity sweep is the same event under its modern name, without the test.
Trading range is what accumulation and distribution both are, read without any claim about intent.
And volume is the half of this method that makes it evidence rather than shape.
What I find genuinely impressive about this is that Richard Wyckoff described the mechanism people now call a liquidity sweep about ninety years before it got that name, and he described it better - because he insisted on volume, and the modern version usually does not. Where I am careful is the phase labelling. Deciding a range is accumulation rather than distribution is a call about intent, and I cannot see intent.
— Michael Whitman, from this video
This page is educational, not financial advice. Test every idea on your own charts before risking money.