What Is the Stock Market?

The stock market is the set of exchanges where shares in companies are bought and sold. A price is simply the last figure a buyer and a seller agreed on, and an index is an average of selected companies rather than the market itself.
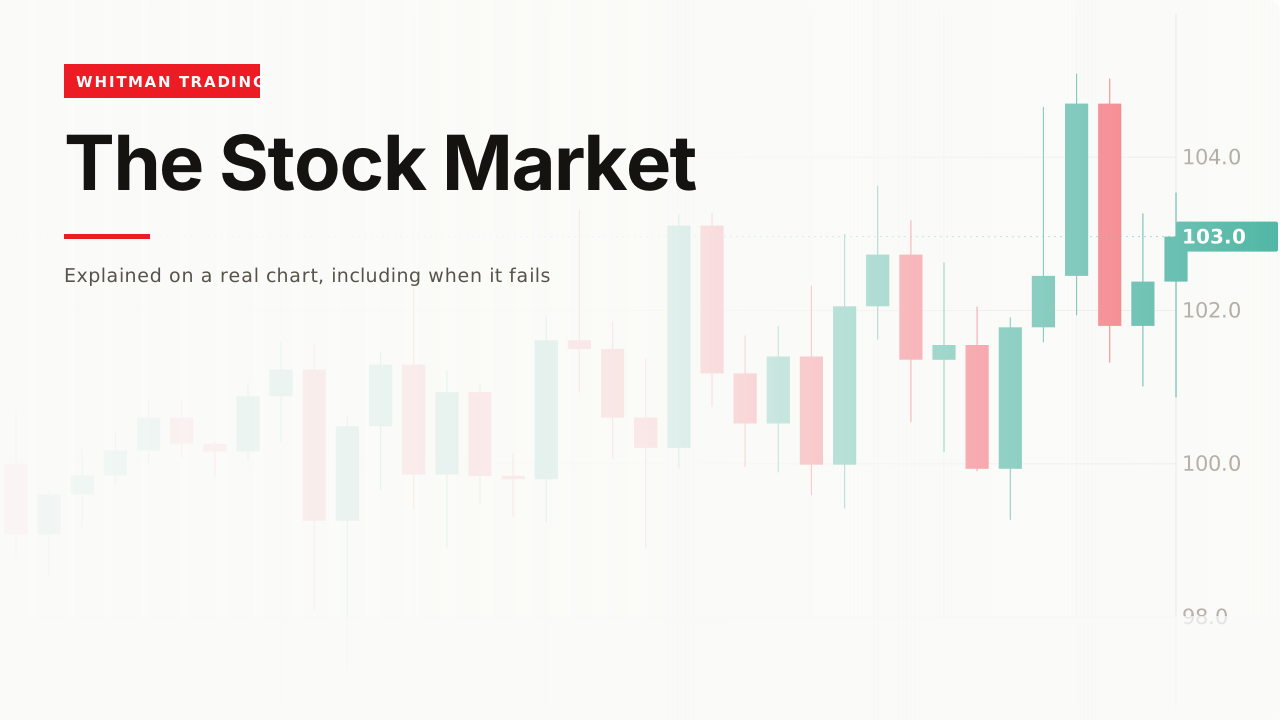
Almost every explanation of this starts with what the market is for. This one starts with what a price on the screen actually is, because everything else on the site is built on that.
How it works

A stock exchange is a place where people who want to buy shares meet people who want to sell them.
A price is the last figure a pair of them agreed on. Not what a company is worth, not what anybody thinks it should be worth — the last number at which a transaction actually happened.
Everything on this site follows from that. A level matters because people transacted there and remember it. A break matters because agreement moved to a new range. Nothing requires anyone’s opinion about the business.
An index is an average

“The market went up today” almost always means an index went up.
An index is an average of a chosen list of companies, usually weighted by their size — so the larger members move it more, and the list is a choice somebody made.
Different indices give different answers on the same day, which is not a contradiction: they are averages of different lists.
And you can trade the average directly, which is what SPY is — a fund that holds the companies so the index becomes one instrument.
It opens and it closes

The main session runs a fixed number of hours on weekdays, with limited trading before and after and none at the weekend.
So the first price tomorrow is a new agreement, not a continuation of today’s last one — which is where gaps come from and why a stop can fill somewhere other than where it was placed.
A market that closes is the normal case and not the universal one. Crypto never closes and forex runs five days straight, and both of those pages describe what changes when the bell disappears.
The volume column

Under each candle is a count of shares traded in that period.
Every one of them had a buyer and a seller, so the number has no direction in it — the volume analysis page is the full version of that point, and it is the most commonly misread thing on a chart.
On a listed share this count is real and consolidated, which is not true in every market and is one of the genuine advantages of trading shares.
What it costs to participate

Buying and selling costs money — commission where it exists, and the spread between the buying and selling price always.
The useful way to hold that number is as a share of the move you are trying to keep, not as a fee. A round trip of 0.02 against a typical bar of 1.17 is under 2%; on a faster timeframe, the same cost is a much larger share of a much smaller move.
That single ratio decides more outcomes than any indicator, which is what the why traders lose money page measures.
Two ways people use it
Worth separating, because the same market serves both and the methods have almost nothing in common.
Investing is buying a share of a business and holding it for years, on a view about the business. The chart is almost irrelevant; the technical and fundamental page describes why.
Trading is buying and selling on a shorter horizon, on a view about price. The business is almost irrelevant, and the chart is the whole of the evidence.
Neither is better and mixing them is the expensive part — a trade held on an investment argument is a trade with no stop, which is the failure mode that appears on almost every page here.
A worked example

Pick one index and watch it for a fortnight without trading it.
Notice the open each day — whether it continues yesterday or starts somewhere else.
Then look up the spread on the instrument you would actually buy, and divide it by a typical daily range.
Those three habits cover most of what this page says, and none of them requires an opinion about any company.
The original data
Across our study of 24,971 trading videos, only 35 explain the stock market itself. The median one gets 88,770 views — the second-highest median measured anywhere in this glossary, behind only long and short at 167,100.
And only 37% fail to pass 50,000 views, the lowest saturation figure measured here.
The corpus carries description text for just two of those 35, which is far too thin to say anything about, and this page does not.
The pattern is worth stating plainly. The most basic question in the subject has one of the smallest fields and one of the largest audiences, while forex has 1,639 videos and a median of 8,397. The demand is at the bottom of the ladder and the supply is at the top.
When it fails
You treated the price as a valuation
A price is an agreement between two people, and the next one may be very different. Everything on this site is a way of reading that record rather than a way of arguing with it.
The index moved and your share did not
An index is an average, and an average is not any of its members. A day the market rises is not a day every company rose.
It did nothing for months

Flat stretches are the normal state, and trading through them to stay busy is the most expensive habit measured on this site.
You judged it from the finished chart

Every chart in every explanation of this subject has its answer already printed. The live one does not, which is the one thing worth taking from a page like this.
Related
Stocks is the practical version: hours, gaps, costs and calendars.
SPY is how an index becomes a single instrument you can actually buy.
And volume is the column under the candles, and what it does and does not say.
The thing I wish someone had put plainly when I started is that nothing on the screen is an opinion about what a company is worth. It is a record of what people paid. Everything I do is reading that record, and none of it is reading anybody’s mind.
— Michael Whitman, from this video
This page is educational, not financial advice. Test every idea on your own charts before risking money.