What Is a Pullback?

A pullback is a temporary move against the direction of a trend before the trend resumes. In an uptrend it is a dip; in a downtrend it is a bounce. It is the most common place traders look to enter, because it offers a better price than chasing the move.
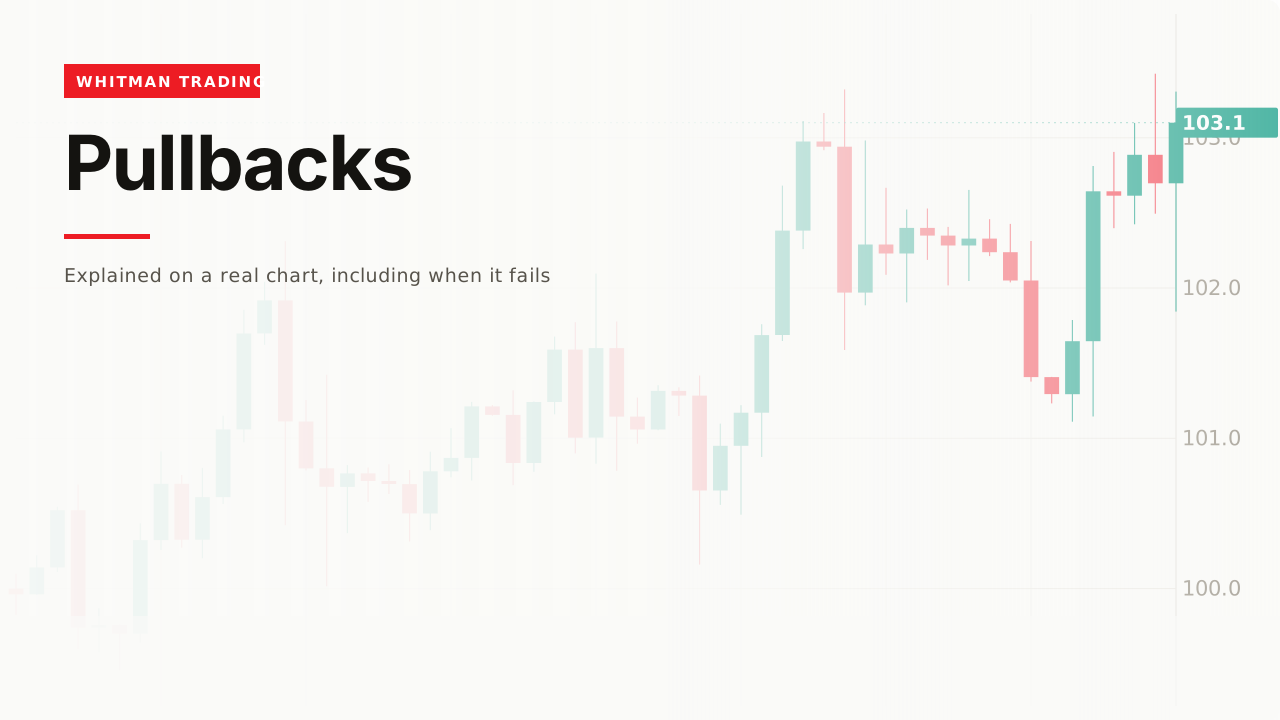
Most entries people take are pullback entries, and most of the difficulty in trading one is that it cannot be told apart from the thing that ends the trend.
How it forms
A pullback is a temporary move against the trend. In an uptrend it is a dip; in a downtrend, a bounce.

The reason it happens is mundane. People who bought earlier take profits, and new buyers wait for a better price. Both of those stop the move without reversing it, and when the selling runs out the trend picks up where it left off.
It is also the reason pullbacks are where most entries happen: you are buying from someone who is finished, at a price better than the high.
They come in different depths

There is no correct depth. A strong trend often gives shallow ones; a tiring trend gives deeper ones, and a deep one is not automatically a warning.
What matters is not how far it went. It is where it stopped.
The test that actually works

In an uptrend, each pullback should end higher than the previous one. That is the same rule as market structure, applied to the dips rather than the highs.
It gives you something specific to watch: not “is this dip too deep” but “did it stop above the last one.” One is a feeling; the other is a price.

The useful pullbacks stop at something you had already drawn — a previous high, a level, a moving average. A dip that stops at nothing in particular has told you nothing.
Sideways counts too
A trend does not have to dip to pause. Sometimes it goes flat instead — price stops advancing and moves sideways for a while before continuing.
That is the same event. The trend is resting either way; the difference is whether sellers pushed price back down or simply stopped buying. A sideways pause is often the stronger of the two, because price gave nothing back at all.
The practical consequence is that waiting only for a dip means missing the trends that pause flat, and there is no rule that says which kind you will get.
Measuring the depth
You will see pullbacks measured with percentages — a third, a half, two thirds of the last move. Those come from Fibonacci retracement levels, and the honest version is this: the numbers are conventions, not forces. They work to the extent that a great many people draw the same ones, which is the same crowding argument as every other level on this site.
Useful as a place to look. Not useful as a prediction.
What the volume does

Bars shrinking through a pullback means people are not rushing to sell into it, which is a different and more encouraging thing than nobody wanting to buy. The volume page covers why that contrast is the reading rather than the raw height.
A worked example
The trend is established. Higher highs and higher lows, marked before any of this.
Price stalls and starts back down. Nothing to do. A dip is not an entry, it is a dip.
It reaches something. The previous high, which is now the obvious place for it to stop.
It holds and turns back up. This is the moment — not because a shape completed, but because the level held and the sequence of higher lows is intact.

The stop goes below the previous pullback low, not below this one. If price only breaks this low the sequence is bent; if it breaks the one before, the sequence is broken. Those are different events and only the second one means you were wrong.
How deep is too deep

Two prices, both of which you can mark in advance:
Below the previous high is a warning — the trend is giving back more than it did last time. Below the previous low it is not a pullback at all, because the thing that made it a trend has stopped being true.
The original data
Across our study of 24,971 trading videos, 189 cover pullbacks and retracements. The median one gets 11,938 views, 66% never pass 50,000, and the median length is 13.6 minutes.
The corpus carries description text for 67 of those 189, and across those 67, zero mention invalidation, failure, or what a bad read looks like.
Zero, on the entry that most traders use most often, whose defining problem is that it is indistinguishable from a reversal at the time.
When it fails
It was a reversal

This is the failure, and it is not solvable. The chart above is the same shape as the pullback that worked, up until the moment it is not. Every pullback looks exactly like this one while it is happening.
What you get is not certainty but a price: the previous low. Below it, you were wrong, and you knew that number before you entered.
One of them is always the last

Every trend ends with a dip that did not come back. The technique that worked three times in a row is the same technique that fails on the fourth, and nothing about the fourth announces itself.
You bought a dip with no trend behind it
A pullback is a move against a trend. If there is no trend, the dip is just a lower price — which is the most expensive way to misread this idea, because “buying the dip” feels identical either way.
You found it afterwards

Every pullback is obvious once the trend has resumed. Cover the right-hand side and it is a chart going down.
Related
Market structure is the page underneath this one — a pullback is only a pullback if a trend exists to pull back from.
Support and resistance is what a useful pullback stops at, and the reason one dip is worth acting on and another is not.
And risk management is where the previous low becomes a position size rather than just a line.
What I actually watch for is whether the dip stops at something I had already drawn. On a live chart I will point at the 20-day average and say that is our support here, and if price comes back to it and holds, that is a pullback I can do something with. If it drifts down through everything I marked and just keeps drifting, I do not have a setup - I have a chart going down slowly, and those are two different things that look the same for about an hour.
— Michael Whitman, from this video
This page is educational, not financial advice. Test every idea on your own charts before risking money.