What Is ATR (Average True Range)?

ATR, or average true range, is the average size of a bar over the last 14 bars, measured in the instrument's own price units. True range accounts for gaps by including the distance from the previous close, and the reading says nothing about direction.
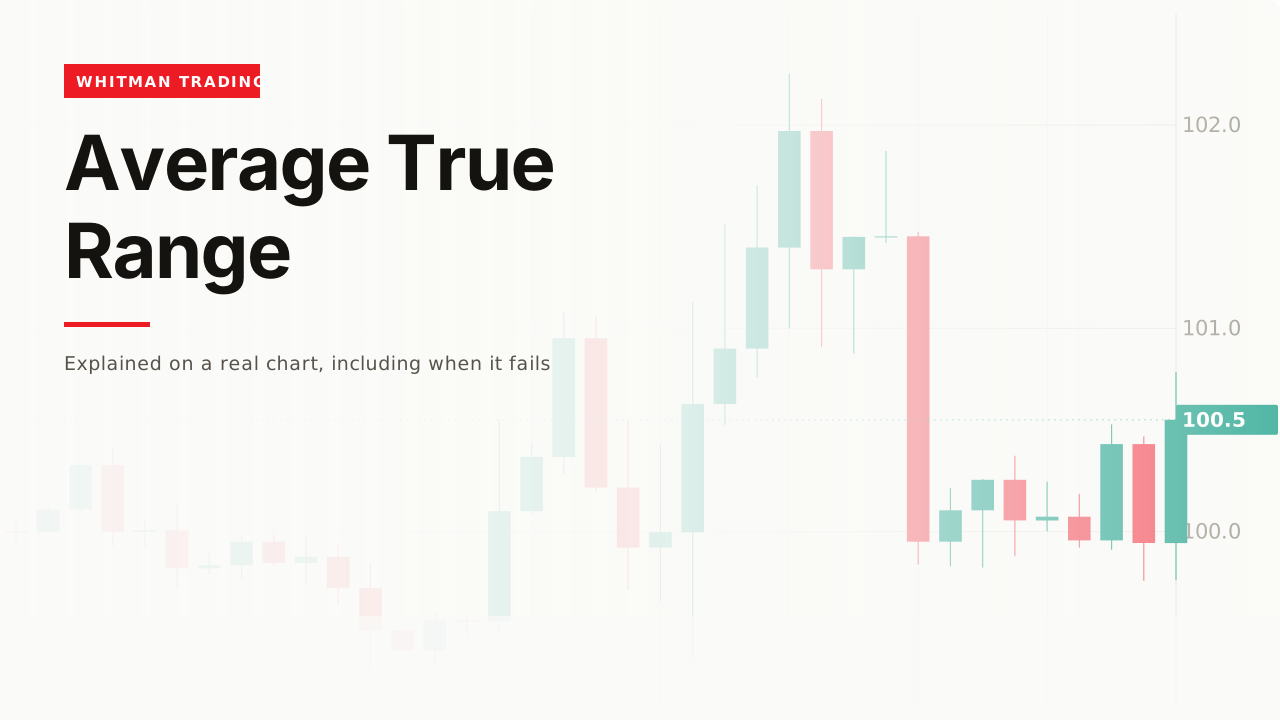
Almost every indicator on this site tries to tell you something about direction. This one refuses to, and that is exactly why it is useful.
How it works

True range is the largest of three distances for each bar:
high − low · |high − previous close| · |low − previous close|
The last two are the “true” part. A plain high-minus-low ignores a gap, so a bar that opened far from yesterday’s close would measure as small when the actual move was large.
ATR is those true ranges averaged over 14 bars. That is the whole indicator.
It is a distance, not a score

The reading is in the instrument’s own units. On the last bar of this chart the ATR is 0.64, which means the typical bar has been covering 0.64 of price.
That makes it directly usable in a way an oscillator is not. RSI at 68 does not tell you where to put anything; an ATR of 0.64 tells you that 0.30 away is inside the noise and 1.30 away is not.
It has no direction in it

This is the part people get wrong. A rising ATR does not mean price is going up.
Measured on this chart: ATR was 0.26 through the calm stretch and 0.71 at the bottom of the selloff. It rose into a falling market, because falling markets have big bars in them.
Rising ATR means “bigger bars”, full stop. Anyone reading it as bullish is reading something that is not there.
Volatility is not a constant

Six times apart, on the same instrument, inside one chart.
That is the fact everything below rests on. A stop distance that made sense at 0.12 is nonsense at 0.71, and a stop distance that survives 0.71 is absurdly wide at 0.12.
A fixed number cannot be right in both conditions, which is the case for using this at all.
What it is actually for

Stop distance, and position size from it.
On this chart 1.5 ATR is 0.96 and a flat 1% stop would be 1.01. They land close together here, and that is a coincidence of this moment — in the quiet stretch 1.5 ATR was 0.18, while the 1% stop would still have been about 1.00, more than five times too wide.
The procedure: pick a multiple, measure the distance, then size the position so that distance costs a fixed fraction of the account. That last step is the risk management page, and ATR is the input it needs.
The settings

One number: the length. 14 is the default and it is worth keeping for the ordinary reason — a shorter one reacts to a single wild bar and gives you a stop distance that changes every session.
A stop distance that moves around is not a risk framework, it is a way of getting a different answer each time you look.
A worked example
Read the ATR before deciding anything. 0.64 here.
Pick the multiple once and write it down. 1.5 gives 0.96; 2 gives 1.28. Choosing it per-trade is choosing the answer you want.
Place the stop at a level, then check it against the distance. The stop belongs below a swing low, and ATR tells you whether that level is a sane distance or whether this setup is too wide to take.
Size the position from the distance, so a 0.96 stop and a 0.30 stop risk the same money.
And re-read it tomorrow. The number moved six times in one chart; last week’s is not this week’s.
The original data
Across our study of 24,971 trading videos, 147 cover ATR. The median one gets 10,863 views, 82% never pass 50,000, and the median length is 8.5 minutes.
The corpus carries description text for 63 of those 147, and across those 63, nine mention invalidation, failure, or what a bad read looks like.
One description in seven — the highest rate of any indicator page in this glossary. Support and resistance manages 7 of 124, about one in eighteen, and candlesticks zero out of 253. Only the risk and psychology subjects beat it, and their whole subject is being wrong.
That is not a coincidence. ATR is a risk tool, and people writing about risk tools talk about being wrong because being wrong is the subject.
When it fails
A single bar beats the average

Measured here: one bar covered 4.1 times the ATR of that moment.
An ATR-based stop is sized for typical conditions and there is no version of it that survives an atypical bar. It reduces how often noise stops you out; it does not put a floor under the loss.
It is backward-looking
Every reading is made of bars that have already happened, so ATR is low right up until it is not. The calm stretch on this chart gave no warning at all — that is not a flaw to be tuned out, it is what an average of the past is.
You read it as a signal
Covered above, repeated because it is the common one. Rising ATR is not bullish and falling ATR is not bearish. It is a size, and sizes have no sign.
You used a percentage instead
The comparison above is the argument. A flat 1% was 5 times too wide in the quiet stretch and roughly right in the loud one — a stop that is only correct in one regime is a stop that is wrong most of the time.
Related
Stop loss is where the distance actually gets used, and why the level matters as much as the number.
Risk management is the step after that — turning a stop distance into a position size.
And Bollinger Bands measures the same thing a different way, with standard deviation instead of bar range.
This is the indicator I actually use every day and it is not a signal, it is arithmetic that sets my stop distance. The mistake I made for a long time was using a fixed percentage stop, which means I was risking the same distance in a dead market and a wild one - so in the wild one I got knocked out by ordinary noise. Sizing off ATR fixed that, and it is the least exciting improvement I have ever made to how I trade.
— Michael Whitman, from this video
This page is educational, not financial advice. Test every idea on your own charts before risking money.