What Is Leverage in Trading?

Leverage lets you control a position larger than your account by borrowing the difference. It multiplies gains and losses by the same factor, so a price move that is trivial at one times becomes decisive at twenty, and the size of an ordinary daily move is what decides whether a given multiple is survivable.
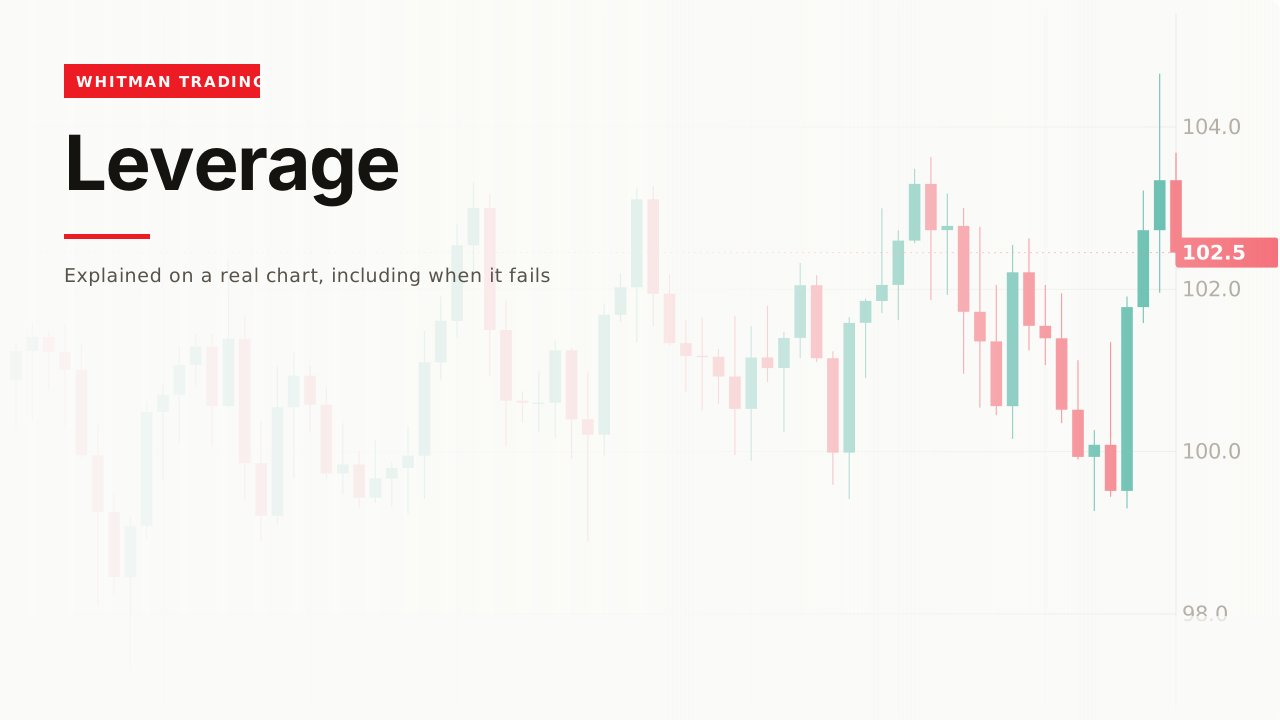
The chart is identical at one times and at fifty. Everything that changes happens on the other screen, and the numbers below are what it changes to.
How it works

You control a position larger than your money by borrowing the rest. At 10× leverage, £1,000 of your own money controls £10,000 of the instrument.
Every price move is then multiplied by ten in your account. A 1% move is 10% of your equity, up or down.
That is the whole mechanism. There is no second effect and nothing about it is subtle.
What it costs in ordinary conditions

On this chart the price is 102.45 and one ATR is 1.61 — about 1.6% of price.

| Leverage | One typical bar against you |
|---|---|
| 1× | 1.6% of equity |
| 5× | 7.8% |
| 10× | 15.7% |
| 20× | 31.4% |
One ordinary bar. Not a crash, not news — the amount this instrument moves on a normal day.
At 20×, a third of the account rides on a single unremarkable bar going the wrong way, and that is the number people mean when they say leverage is dangerous. It is worth having it as a number rather than a warning.
How close the end is

At 20×, your entire equity is consumed by a 5% move against you. On this instrument that is 5.12 in price — 3.2 typical bars.
Three ordinary bars in a row. No unusual event is required, and there is nothing in the chart that would look remarkable while it happened.
Volatility moves the answer

The same leverage is a different risk on different days.
Measured across this history: at 20×, one typical bar costs 11% of equity in the quietest stretch and 32% in the loudest. Three times the risk, same setting, same instrument.
Which is the position sizing argument arriving through a different door. A fixed leverage is a fixed position size, and a fixed position size means the money at risk moves with the market instead of with your decision.
The correct way round

Leverage should be an output, not an input.
Place the stop. Divide the money you will risk by the distance. That gives the position. Whatever leverage that position implies is the leverage you are using, and you never chose a number at all.
Done in that order, the entire subject disappears. Done the other way — pick the leverage, then find a stop that survives it — you have decided your loss before looking at the chart.
High available leverage is not itself a problem. Using it because it is available is.
Where the leverage actually comes from
Worth separating, because “leverage” names several different arrangements with different failure modes.
A margin loan — you borrow cash against the position, pay interest, and the broker can demand more collateral or close you out. Common in stocks.
Built into the contract — a futures contract controls a large notional value for a fraction of it posted as margin. The leverage is a property of the instrument, not something you switched on, which is why futures traders can be highly leveraged without ever choosing a number.
A quoted multiple — spread bets, contracts for difference, and crypto perpetuals let you name the figure directly, which makes it feel like a strategy setting rather than a loan.
Options are leveraged too, in a way none of the above describes: the multiple is not fixed and changes as price moves, so the arithmetic on this page does not transfer to them.
The distinction that matters is who decides when you are closed. In every arrangement here except an unlevered position, somebody else can end the trade at a price of their choosing — and the numbers above are how far away that price is.
A worked example
Work out one ATR as a percentage of price. 1.6% here. Two minutes.
Multiply by your leverage. That is what one ordinary bar costs you.
If that number is uncomfortable, the leverage is too high — and it does not become acceptable because you intend to be right.
Then size from the stop anyway, and treat the leverage as a fact about the position rather than a setting to choose.
The original data
Across our study of 24,971 trading videos, 57 cover leverage. The median one gets 36,446 views, and only 56% fail to pass 50,000.
That 36,446 is one of the highest medians measured anywhere in this glossary, on one of the smallest fields — against 2,270 for position sizing, which is the arithmetic that makes leverage safe to use.
Sixteen times the audience for the exciting half of the subject.
The corpus carries description text for 53 of those 57, and across those 53, nine mention invalidation, failure, or what a bad read looks like — about one in six, which is a comparatively high rate and still leaves five in six that do not.
When it fails
The gap settles it before you can act

A stop is an instruction, not a guarantee of price. The 0.50 gap above is 10% of equity at 20×, taken between one bar and the next with no opportunity to respond.
At high leverage the gap risk is the whole risk, because the ordinary risk is already managed by the stop and this one is not.
Margin is called before you are wrong
Being liquidated is not the same as being wrong. A position can be closed by the broker at the worst moment of a move that then goes exactly where you thought — and the position no longer exists to benefit.
Leverage converts “wrong” into “wrong or unlucky about the path”, and the second one has nothing to do with analysis.
The costs run with time
Financing on a leveraged position accrues daily, which the position trading page sets out. A leveraged position held for months pays for the privilege every one of those days.
You judged the leverage from the chart

Nothing on a price chart says what multiple is appropriate. It comes from the account, the stop, and the volatility — and a chart that looks calm is not evidence about the next three bars.
Related
Risk per trade is the arithmetic that makes leverage an output instead of a choice.
ATR is the measurement every number on this page is built from.
And risk management is why a 31% single-bar loss is a different category of problem from a 1.6% one.
The way I think about this now is that leverage is not a decision I make, it is an output. I place the stop, I work out the size from the money I am willing to lose, and whatever leverage that implies is what I use. When I was choosing leverage first I was choosing how much to lose first, which is exactly backwards, and it took an expensive week to see it.
— Michael Whitman, from this video
This page is educational, not financial advice. Test every idea on your own charts before risking money.