What Is a Fair Value Gap?

A fair value gap is a three-candle pattern where the first candle's high sits below the third candle's low, leaving a band of prices that only one fast candle traded through. Price frequently returns to that band later, which is the whole reason traders mark it.
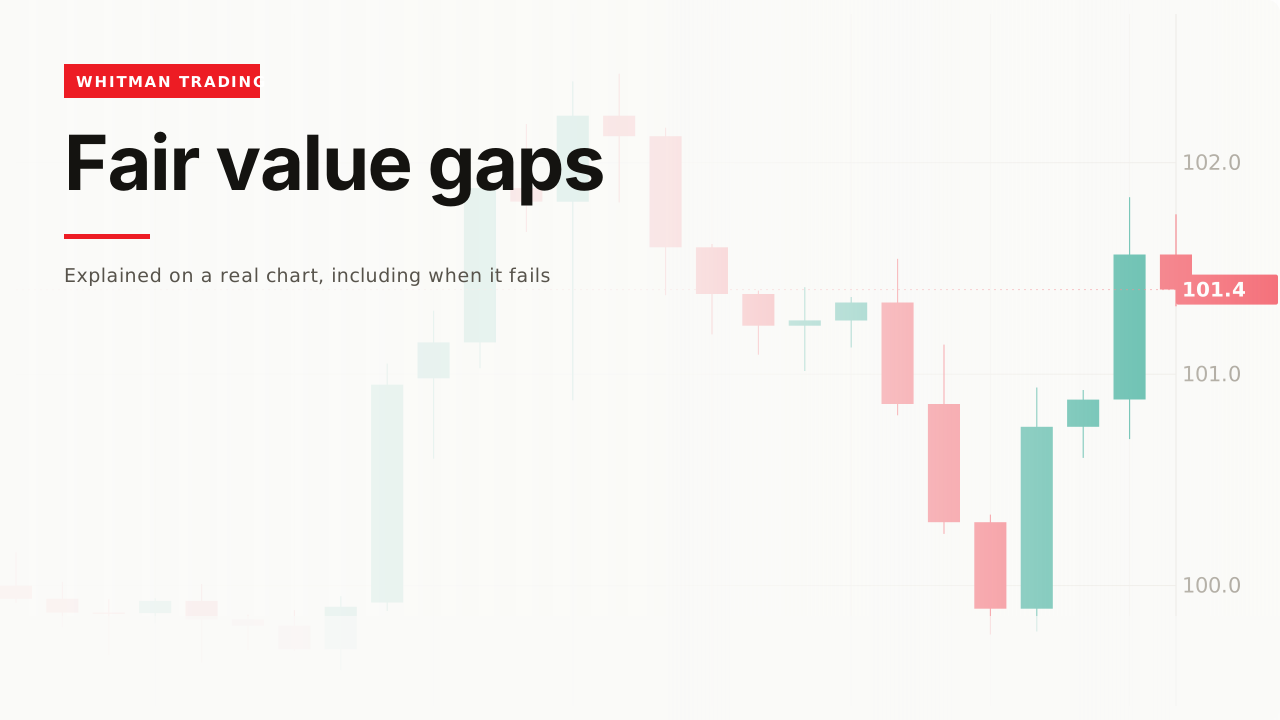
Of all the smart-money terms, this is the one people mark most often and understand least — mostly because the name is misleading.
How it forms
A fair value gap is a three-candle pattern, and the rule is about the first and third candles. The big candle in the middle is what catches your eye, but it is not what you measure.

Here is the test, and it is the only one: draw a line across the high of candle one and a line across the low of candle three. If there is space between them, that space is a fair value gap.
Now the naming problem. In normal usage a gap means a hole in the chart — Friday closes at one price, Monday opens somewhere else. A fair value gap is not that. Price traded through every level in the band. It just did it so fast that only one candle covers the whole range.

That distinction is worth holding onto, because it explains why the band matters at all. A range that one fast candle crossed is a range where very little business got done — few buyers and sellers actually transacted at those prices. It is unfinished, and unfinished things tend to get revisited.
The fill
When price comes back into the band later, traders call that filling the gap.

It does not need to fill completely. Price often turns from around the midpoint of the band rather than travelling all the way to the far edge, which is why the midpoint is the level worth drawing rather than the boundaries.

If you sit waiting for a full fill you will watch a good many of these turn halfway and leave without you. That single adjustment — mark the middle, not the edges — changes how usable the idea is.
The bearish mirror
Everything above works upside down, and almost nobody draws it.

In a fast move down, candle one’s low sits above candle three’s high. If you only ever look for the bullish version you are marking half a chart — the same blind spot beginners have with order blocks.
The commonest mistake
Three candles with a big one in the middle is not enough. They have to not overlap.

This is where charts get covered in boxes. Any strong candle looks like it should qualify, and most of them do not. Check the two lines every time before you draw anything — it takes three seconds and removes most of the false ones.
It sits on top of an order block
These two are usually the same area of chart, marked two different ways.

The order block is the candle before the move. The gap is the space the move left behind. When they line up you are not looking at two independent signals — you are looking at one event described twice, and treating it as confirmation is a mistake worth naming.
A worked example
Read the first chart the way you would at the time, left to right.
The three candles print. You do not know yet that anything happened. You have a strong candle, which is common, and no reason to act.
You run the test. Candle one’s high is 99.95. Candle three’s low is 100.60. There is space between them, so a gap exists and the band is 99.95 to 100.60.
You mark the midpoint at roughly 100.28, and then you do nothing, because a fresh gap is not an entry. Price is above it and moving away.
Price returns. It falls back into the band and reaches the midpoint. Now there is something to act on, and the reason has nothing to do with a pattern appearing — it is that price is back in a range it crossed without doing much business.

The stop goes below the whole band, not inside it. A stop within the gap is a stop inside the zone you expect price to work through, which is a good way to be right and lose anyway.
The original data
Across our study of 24,971 trading videos, 226 cover fair value gaps. The median one gets 22,190 views, 60% never pass 50,000, and the median length is 14.7 minutes.
The corpus carries description text for 87 of those 226, and across those 87, two mention invalidation, failure, or what a bad read looks like.
Small window, so a hint rather than a census. But two in 87 on a topic where the whole practical question is which of the dozen gaps on your chart matters is a real hole in what is being taught.
When it fails
It fills and keeps going
The band is a range, not a floor. Price can pass straight through it without pausing.

These happen far more than the taught version suggests, and they are easy to overlook, because a gap that filled and did nothing leaves no memorable chart. The ones that reversed are the ones that end up in videos, which is exactly why the idea feels more reliable than it is.
There are too many of them
Zoom in far enough and every chart is full of gaps. On a one-minute chart there will be dozens, and dozens of levels is the same as none.
The practical fix is to mark them only on the timeframe you actually trade, and only where one sits with something else — a level, a break of structure, an order block.
You found it afterwards
Every filled gap is obvious once it has filled.

Scrolling back to find the gap that worked is the same failure that ruins every other level-based idea, and it feels exactly like analysis while you are doing it.
Related
An order block sits in almost the same place as a gap and is the more precise of the two, so it is the one to mark first.
Whether a fill matters at all depends on market structure — the same band means opposite things depending on which way the highs and lows are going.
And the reason price comes back to these ranges is liquidity: orders resting where everyone can see they should be.
I will be honest with you about these, because most people teaching them will not be. I am not the biggest fan. They have real merit if you are scalping and much less if you are not - and the bigger problem is that there are so many of them on every single chart that once you see them, you cannot unsee them. That is not an edge, that is clutter.
— Michael Whitman, from this video
This page is educational, not financial advice. Test every idea on your own charts before risking money.