What Is an Opening Range Breakout?

An opening range breakout uses the high and low of the first part of a session as a range, and treats a close outside it as an entry. The length of the opening period is chosen by the trader, and it decides both the size of the range and how much of the session's move is left.
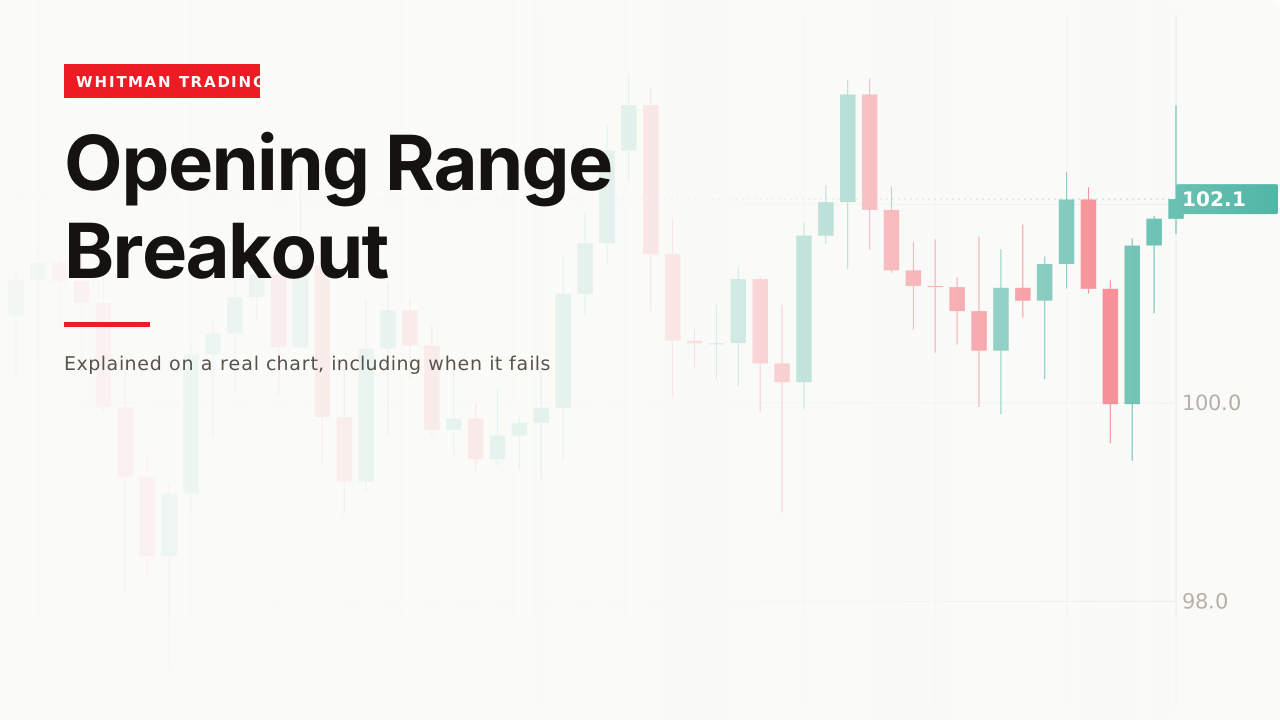
The most mechanical entry in this glossary: a clock draws the level, so nobody gets to argue about where it goes. What that costs is the subject of this page.
How it works

Take the high and low of the first part of the session. On this chart, the first six bars gave 98.10 to 101.59.

A close outside that range is the entry. Above the high for a long, below the low for a short.
No judgment anywhere in it. The level comes from the clock, which is the whole appeal.
What the mechanical level costs

The opening range was 3.49. The entire stretch covered 6.01.
So the range itself contained 58% of all the movement there was. By the time price closed outside it, most of what the session had to give had already happened inside it.
That is the structural cost and it is worst on the best days. A volatile session produces a wide opening range, which needs a big move to break, which means you enter late in exactly the move you most wanted.
The period is your choice

Three bars gave a range of 1.83; twelve gave 3.49.
Shorter is a tighter level and more false breaks. Longer is a more meaningful level and less left to trade. There is no setting that avoids both, and the common choices — the first 15 minutes, the first 30, the first hour — are conventions rather than findings.
The one real argument for a particular choice is the crowding one: if enough people use the first 30 minutes, that level has orders resting at it, which is the mechanism the support and resistance page describes.
Most breaks are not the move

Ten closes outside the range, and price changed which side it was on.
Taking every close outside as a signal means several trades, most of them reversed. That is the breakout page’s finding arriving here in its most concentrated form, because the opening range is tested repeatedly by construction — it sits in the middle of the day’s action.
The target convention

Project the range height from the break. Here that is 3.49 above 101.59.
It is a convention, not a mechanism — the same measured-move idea the chart patterns page examines, and it inherits the same honest defence: choosing a number before you enter beats choosing one while the position is open.
Which open, and why it matters
The strategy assumes there is one opening, and for most instruments there is more than one.
A stock has a genuine open. Trading stops overnight, orders accumulate, and the first minutes clear them. The opening range there is measuring something real: the price at which a backlog got resolved.
Futures and currencies trade nearly around the clock. There is no single moment when trading resumes, so “the open” means a session convention — the London open, the New York open, the Tokyo open — and each produces a different range on the same instrument on the same day.
So the London breakout and the New York opening range are the same strategy on different clocks, and a market can break one and not the other.
The consequence for the crowding argument is direct. The level works to the extent that people are watching it, so the useful question is not which open is philosophically correct but which one the participants in this instrument actually use. On a US equity, the 9:30 open. On a currency pair, whichever session carries the volume — which the trading sessions page covers.
A worked example
Fix the opening period before the session and never change it. Fifteen minutes, thirty, one hour. Write it down.
Mark the high and the low when that period ends. Two prices, no judgment.
Wait for a close outside, not a touch — the same rule this site applies to every level.
The stop goes back inside the range, because a return there means the break did not hold. That distance is also the position size, via risk management, and on a wide opening range it will make the trade too big to take. That is the range telling you something.
The original data
Across our study of 24,971 trading videos, 160 cover the opening range. The median one gets 14,939 views, 72% never pass 50,000, and the median length is 12.1 minutes.
That is a strong median — above gap trading at 8,535 and reversals at 8,860.
The corpus carries description text for only 13 of those 160, which is too thin a sample to say anything about how the topic is written, so this page does not.
When it fails
A quiet open makes a meaningless level

A narrow opening range breaks on nothing, because it does not take much movement to leave a small box. Every one of those breaks is a signal by the rule.
A wild open makes an untradeable one
Covered above and it is the mirror. 58% of the movement inside the range on this chart, and a stop back inside it that is too wide to size around.
The clock is not the market
Nothing makes the first thirty minutes special except that everyone agreed to watch it. That is a real mechanism and it is the only one — the opening range has no claim on the market beyond the attention it receives.
You remember the days it worked

A trending day makes this strategy look inevitable. At the moment of the break, that day and the one where price came straight back are the same picture — and there are ten closes outside on this chart, of which one was the move.
Related
Breakout is what this is, with the level supplied by the clock instead of by price.
Day trading is the style it belongs to, including the cost arithmetic that decides whether several attempts a day is viable.
And trading sessions is why the open is where this is done at all.
What I like about this is that the level is not a judgment call - the clock draws it, so I cannot move it to suit myself, and that removes my worst habit in one step. What I had to learn the hard way is that the opening range on a wild day is enormous and by the time it breaks the move is largely done, which is exactly the day you most want to be trading. The mechanical level is bought at the price of a bad one on the days that matter.
— Michael Whitman, from this video
This page is educational, not financial advice. Test every idea on your own charts before risking money.