What Is Position Trading?

Position trading means holding for months or longer, taking a small number of large moves. It has the lowest transaction cost as a share of each trade and the fewest decisions, and it requires sitting through the largest adverse moves of any style.
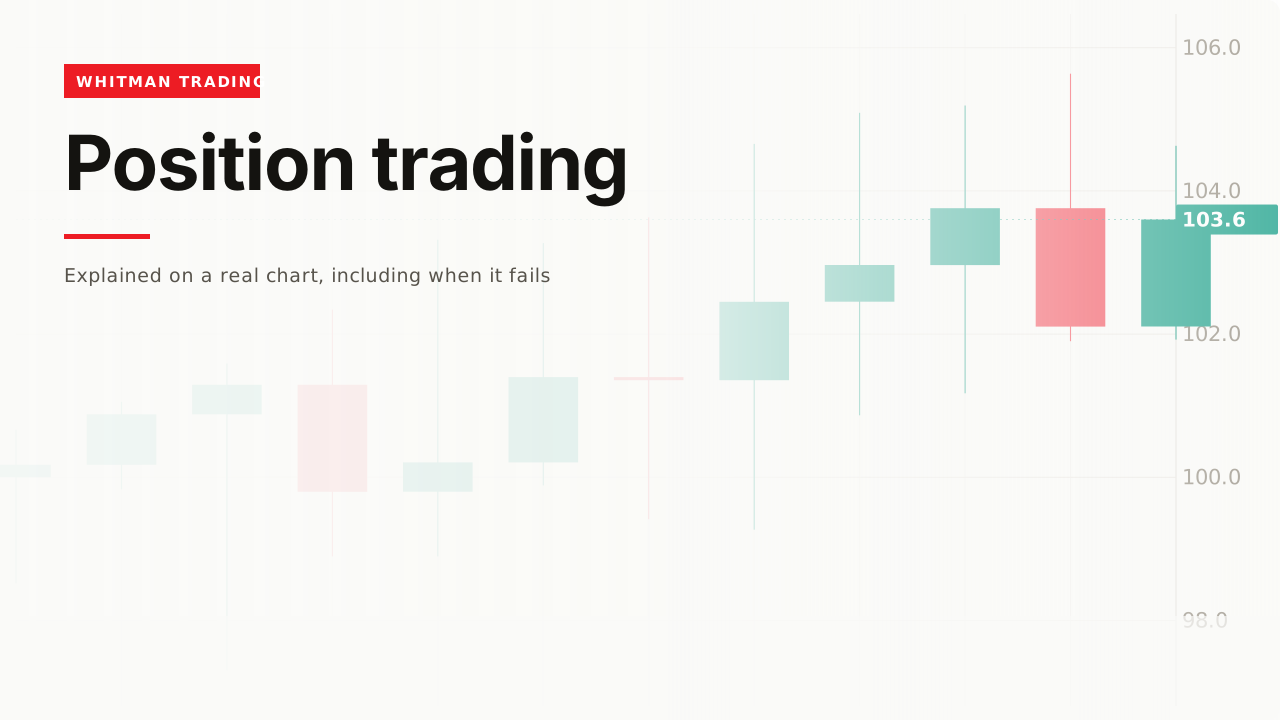
The four style pages here are aggregations of one price history. This is the slowest view, and the numbers are the most favourable and the least achievable on the site.
How it works

Hold for months. The whole shared history — 576 bars to a scalper — is twelve candles here.

Twelve decisions. That is the entire workload of this style across the same market and the same period.
The arithmetic is the best on the site

The typical bar covers 3.88, against 0.49 on the fastest view of the identical data.

A 0.02 round trip is 0.5% of that — eight times less burden than scalping the same market.
| Style | Bars | Typical bar | 0.02 costs |
|---|---|---|---|
| Scalping | 576 | 0.49 | 4.1% |
| Day trading | 144 | 1.17 | 1.7% |
| Swing trading | 48 | 2.26 | 0.9% |
| Position trading | 12 | 3.88 | 0.5% |
At 0.5% the cost stops being something you have to plan around. Every other page on this site has to argue about execution; this one does not.
What is inside one of these candles

Every trade a scalper took, every session a day trader closed out, sits inside a candle here.
That is not a rhetorical point — it is the same data. The faster styles are not seeing more; they are seeing the same thing subdivided, which is the argument on the timeframes page in its most extreme form.
What it actually costs

Holding from the first bar meant watching the position go 2.87 against.

And the whole history netted 3.60.
Read those two numbers together, because they are the page. The adverse move you had to sit through was four fifths of the entire gain — and at the moment it was happening, nothing said which of the two it would turn out to be.
That is why the best arithmetic on this site belongs to the style fewest people run. The cost is not paid in fees; it is paid in months of holding something that is losing.
The costs the table above misses
Worth saying plainly, because the cost column on this page flatters the style.
That table counts the spread and commission you pay to get in and out. Those are the costs the fast styles are dominated by, and at 0.5% of a bar they are close to irrelevant here.
A long hold has different costs, and they accrue with time rather than with trades.
Financing, if the position is leveraged. A margin loan or a futures roll or a funding rate on a perpetual charges by the day, so a position held for four months pays about a hundred and twenty times what one held overnight pays.
Dividends and corporate actions, if it is a stock. Long, you receive them; short, you pay them — and over months that is a real number in either direction.
And capital tied up. Money committed to a months-long position is not available for anything else, which does not appear on any statement and is nonetheless a cost.
So the honest version of the table is this: the fast styles pay per trade and the slow ones pay per day. Neither column is free, and this page’s column simply is not the one being measured.
A worked example
Decide the thesis on something other than a chart. At this horizon the reason to hold is generally not a chart pattern — and this site is about charts, so the honest thing to say is that the analysis here reaches past what these pages cover.
Size for the drawdown, not for the entry. 2.87 against on this history, and the position has to be small enough that carrying that changes nothing about your life.
Name the invalidation as a condition, not a candle. A stop three bars away is meaningless when a bar is a month.
Then leave it alone. Checking a months-long position daily converts it into a stressful swing trade with no exit plan.
The original data
Across our study of 24,971 trading videos, 53 cover position trading. The median one gets 4,349 views, 92% never pass 50,000, and the median length is 15.4 minutes.
53 is one of the smallest fields measured here — against 1,465 for day trading, twenty-eight times as many videos for a style that is one step faster.
And 92% ties for the most saturated, level with Hull moving averages — a small field that nobody watches.
The corpus carries description text for one of those 53, which is far too few to say anything at all about how the topic is written, so this page does not try.
When it fails
The drawdown is the whole story
Covered above and worth repeating as the single fact to take away: 2.87 of adverse movement to capture 3.60 of gain. Every other difficulty on this page is downstream of that one.
Twelve decisions is not fewer chances to be wrong
It is fewer chances to be right. With twelve bars there is no law of averages working for you — one bad read is a large fraction of everything you did, and there is no next trade this afternoon to make it back.
The horizon outlasts the reason
A thesis held for months has to survive the world changing. Whatever made the position sensible in month one may simply no longer be true in month five, and nothing on the chart announces that.
You looked at it once it had worked

Four bars in, the position is losing. A completed hold looks like conviction; an incomplete one looks like a mistake, and the two are indistinguishable at the time — which is exactly why the sizing decision has to be made before any of it.
Related
Swing trading is one step faster and the version of this most people can actually hold to.
Timeframes is why the same history can be twelve candles or five hundred and seventy-six.
And risk management is what makes a 2.87 drawdown survivable, which is the only real requirement of this style.
I do not run positions for months and the reason is honest rather than analytical: I would not sit still for it. What I think is genuinely true about this style is that the arithmetic is the friendliest of the four and almost nobody can do it, because the thing it asks for is not a skill you can practise on a chart. It asks you to watch a position lose money for weeks and do nothing, which turns out to be much harder than analysis.
— Michael Whitman, from this video
This page is educational, not financial advice. Test every idea on your own charts before risking money.