How Is Trading Gold Different?

Gold is traded as spot, as futures and through funds, and each carries different costs, hours and volume data. Because it is quoted in dollars, part of every move on the chart is the dollar rather than the metal, which is the difference most technical material about it leaves out.
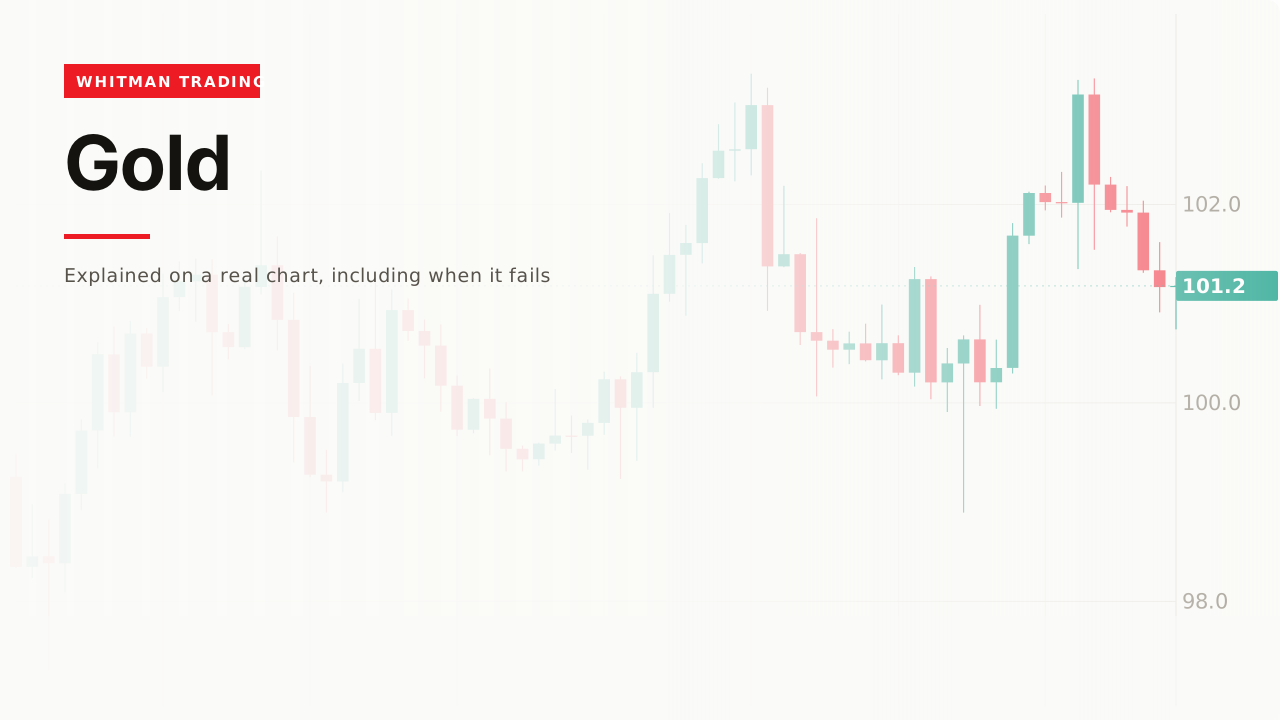
Gold gets treated as a single thing and it is at least three, each with its own costs and its own data. And the chart carries two stories at once.
How it works

Three routes to the same exposure, and they are not interchangeable.
Spot — quoted by brokers as a currency pair against the dollar, with a spread and no expiry. Most retail gold trading is here.
Futures — an exchange-traded contract with a fixed size, a real volume series and an expiry date. Everything on the futures page applies, including the roll.
Funds — an exchange-traded product bought like a share, with stock market hours and stock market gaps.
The technical reading is identical across all three. The costs, the hours, the volume data and the gap behaviour are not, so “how do I trade gold” has to be answered instrument-first.
One: it is partly a dollar chart

Every quote is a ratio, exactly as the forex page describes: so many dollars per ounce.
Which means the chart can rise because the metal is in demand or because the dollar has weakened, and it does not distinguish them.
The practical consequence is the same one the stocks page reaches about the index: a clean setup taken on a day the dollar moves sharply is not a setup that failed on its own terms. The input changed underneath it.
The cheap version of accounting for it is to glance at a dollar index before entry. Not as a signal — as a condition, so you know whether you are taking a metal trade or a currency trade.
Two: the hours are nearly continuous

Gold trades almost all day, and participation is far from even across it.
The busiest stretch is the London and US overlap, which is where the majority of the day’s range is usually made — the same argument, with the same practical use, as on the trading sessions page.
A level tested in the quiet hours has been tested by fewer people, which is a reason to weigh it less rather than a reason to ignore it.
Three: only one route has real volume

Spot gold has no central exchange, so the volume on a spot chart is your broker’s own flow — the same limitation the forex page describes.
The futures contract does have a consolidated tape. Which is why serious volume profile work on gold is done on the futures chart even by people who then trade the spot.
Two charts, one metal, and only one of them can support a volume threshold.
Four: the news is partly scheduled

Interest-rate decisions and inflation figures are published on known dates, and gold reacts to them.
That makes part of its calendar knowable in advance, exactly like a company’s earnings date, and it makes “not holding a leveraged position into the announcement” a decision available beforehand.
The rest is not scheduled at all, and no chart contains it — which is the boundary the technical and fundamental page draws.
The three instruments, side by side
| Spot | Futures | Fund | |
|---|---|---|---|
| Hours | Nearly 24, five days | Nearly 24, one daily break | Stock market hours |
| Expiry | None | Yes — roll required | None |
| Volume data | Broker’s own | Exchange-consolidated | Exchange-consolidated |
| Overnight gap | Weekend only | Small daily break | Every night |
| Leverage | Broker setting | Built into the contract | Only via margin |
| Smallest size | Fractional | One contract | One share |
Read that table as a set of trade-offs rather than a ranking.
The fund is the simplest and the most gap-exposed. The futures contract has the best data and the least flexible size. Spot is the most convenient and the least measurable.
Whichever you pick, the choice is made once and everything downstream follows from it — the stop distance in money, the volume tools available, and whether an overnight hold carries gap risk at all.
A worked example
Pick the instrument first. Spot for convenience, futures for data and standardisation, a fund for stock-market simplicity.
Then work out the cost as a share of a typical bar on that instrument specifically.

Check the rate calendar before taking anything you intend to hold.
And glance at the dollar, so that a currency move does not arrive as a surprise inside a metal trade.
The original data
Across our study of 24,971 trading videos, 439 cover gold trading. The median one gets 8,054 views, 74% never pass 50,000, and the median length is 11.0 minutes.
The corpus carries description text for 25 of those 439, and across those 25, one mentions invalidation, failure, or what a bad read looks like.
One in twenty-five, on an instrument routinely traded with high leverage. It sits beside options at 22% and Bitcoin at zero — the market pages in this glossary vary enormously on this measure, and gold is near the bottom.
When it fails
The dollar moved and the metal did not
A correct read of gold can lose to a currency move, and it will not look like that on the chart. It is the single most common surprise on this instrument.
The volume threshold was on the spot chart
A rule tuned to your broker’s flow is tuned to your broker, which is not a property a tested rule should have.
The rate decision was tomorrow
Scheduled events are the cheapest risk to avoid on this page, because the dates are public and the decision to be flat is free.
It did nothing for years

Long flat periods are normal here, and trading through them to stay busy is the cost the why traders lose money table measures.
You judged it from the finished chart

The chart the evening before an announcement looks like any other evening, which is exactly why the answer has to come from the calendar rather than from the price.
Related
Futures is the version of this market with real volume and a standardised contract.
Forex is where the dollar half of every gold quote comes from.
And trading sessions is why the same level is worth more in some hours than in others.
The thing I check on a gold chart that I do not check anywhere else is what the dollar has been doing. Twice I have taken what I thought was a clean technical long in gold and been on the wrong side of a dollar move that had nothing to do with the level I was trading.
— Michael Whitman, from this video
This page is educational, not financial advice. Test every idea on your own charts before risking money.