What Are Renko Charts?

A Renko chart draws a brick every time price moves a fixed amount, ignoring time completely. Every brick is the same size, so a quiet hour and a violent minute can produce the same number of them. The brick size is the only setting, and changing it changes every pattern on the chart.
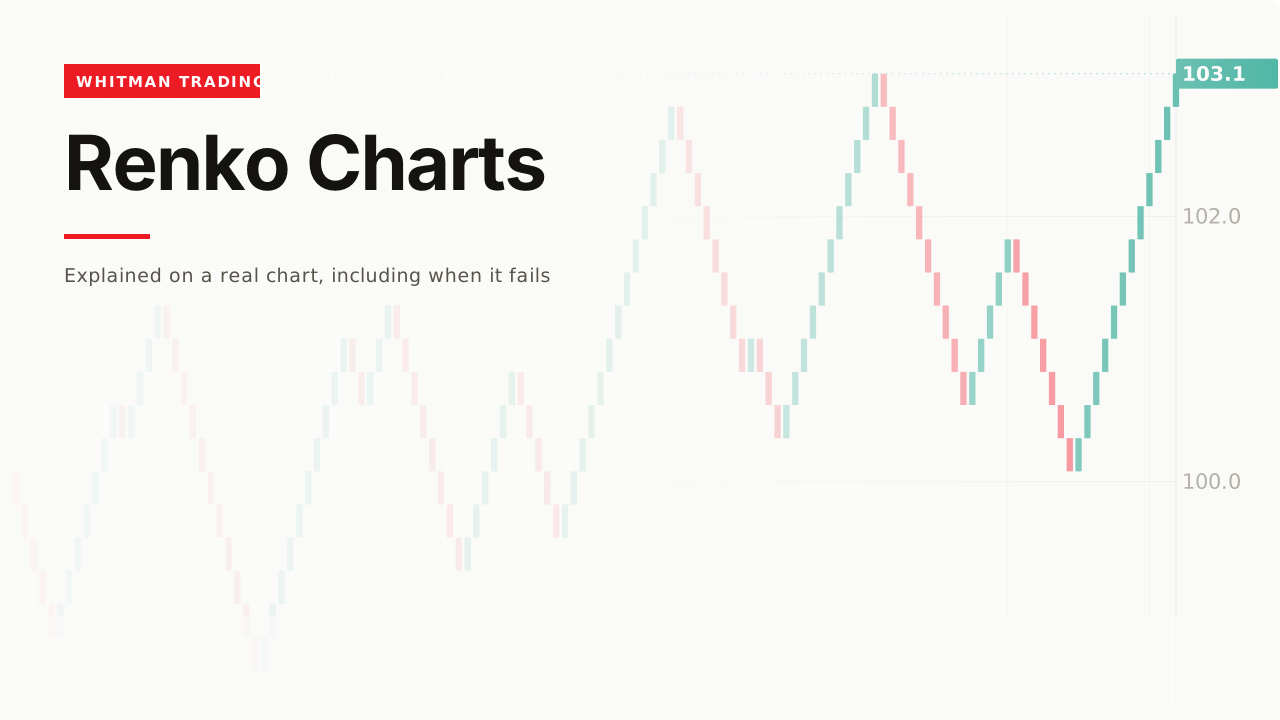
Every other chart on this site has time along the bottom. This one does not, and almost everything strange about it follows from that.
How it works

Here is the ordinary chart: eighty bars, one per unit of time, wide where price moved a lot and narrow where it did not — but each one occupying the same slot on the axis.

Here is the same price as Renko. A brick is printed every time price moves 0.25 from the last brick. If price moves 1.00 in one bar, four bricks print at once. If it moves 0.05 for a week, nothing prints at all.
Every brick is the same height and the same width. That is the entire construction.
What removing time costs

Measured on this data: the slowest brick took 4 bars to form, and one single bar produced 6.
Both are drawn identically. A brick is a brick.

So the chart cannot show you speed, and speed is information. A market that covered 1.50 in one bar and one that covered it over a fortnight produce the same six bricks, and the first is a very different event from the second.
Brick size is the whole indicator

132 bricks at 0.25, and 49 at 0.60. Same price history.
This is not a sensitivity setting, it is the chart. Every pattern you think you see, every trend that looks clean, every reversal — all of it is a function of the number you typed into one box.
And there is no correct value. Some platforms offer ATR-based sizing, which at least makes the brick scale with volatility rather than staying fixed while the market changes underneath it — but that turns the brick size into a moving number and makes two charts of the same instrument non-comparable across time.
What it is good at

Trends look extremely clear, and that is a real benefit rather than an illusion. A run of same-coloured bricks is exactly what a sustained directional move is, with the noise that would have interrupted it filtered out by the fixed step.
If your problem is that you exit trends too early because every red candle worries you, this genuinely addresses that — the same case the heikin ashi page makes, taken further.
The right edge is not final
A brick prints when price has moved a full brick, so until that happens there is nothing to draw.
The consequence is that the most recent brick can change. Price moves toward a new brick, the chart shows what it shows, price comes back, and the brick that was about to print never does.
So a Renko chart is not a record of what you could have acted on. The historical part is settled and the live part is provisional, which is the same problem the Supertrend page describes and is more severe here, because the entire chart is built this way rather than one line on it.
Which price builds the brick
A detail that changes the chart substantially and lives in a settings dropdown almost nobody opens.
Most platforms offer two sources: closes, or highs and lows.
Built from closes, a brick prints only when a bar closes far enough away. A spike that reached the level intrabar and came back prints nothing, so the chart is quieter and the bricks correspond to prices the market actually settled at.
Built from highs and lows, the same spike prints its bricks. The chart is busier and it registers extremes the close-based version never shows.
Neither is wrong and they produce visibly different charts, which matters for the same reason the brick size does: two people comparing Renko charts of one instrument may be comparing four possible charts rather than one.
The close-based version is the more conservative choice, and it is consistent with the rule this site applies everywhere else — that a wick through a level is not a break, and the close is what settles it.
A worked example
Choose the brick size deliberately and write it down. It is the only decision and it determines everything you will see.
Read runs, not patterns. A long run of one colour is the honest output. Shapes made of bricks are shapes made by your brick size.
Take prices from the time chart. Brick boundaries are multiples of your setting from an arbitrary starting price — they are not levels anyone else is watching.
And wait for the brick to complete before treating it as having happened.
The original data
Across our study of 24,971 trading videos, 72 cover Renko charts. The median one gets 5,347 views, 86% never pass 50,000, and the median length is 8.7 minutes.
The corpus carries description text for 69 of those 72 — nearly the whole field — and across those 69, three mention invalidation, failure, or what a bad read looks like.
When it fails
The range does not disappear

42 sideways bars produced 19 bricks.
The claim you will hear is that Renko removes the chop. It removes the appearance of chop while printing alternating bricks anyway — and each of those alternations is a full brick of price movement, which is exactly the thing that would stop you out.
It looks better than the market was
A clean chart of a messy market is not an improvement, it is a filter. The bricks that did not print were real price action, and some of it was the market failing to continue.
Two people see different charts
Your 0.25 and their 0.50 are different instruments. There is no shared level, no shared pattern, and no way to compare notes — the opposite of the crowding argument that makes ordinary levels work on the support and resistance page.
You backtested it without the time axis

A Renko backtest that assumes you traded at brick boundaries assumes you knew a brick would complete. Some of them did not, and that is the difference between the chart and what happened.
Related
Candlesticks is what a brick replaces, and what the four prices in a bar actually carry.
Heikin ashi is the other smoothed chart here — it keeps the time axis and smooths the prices, which is the opposite trade.
And timeframes is the idea Renko discards entirely, and worth reading to see what is being given up.
The appeal is obvious the first time you see one, because a Renko chart of a trend looks like the cleanest thing you have ever seen. What took me longer to notice is that it looks clean because it has thrown away the information that would have made it look messy, and some of that information was the part telling me the move was slowing down. I do not run these, and I understand why people do.
— Michael Whitman, from this video
This page is educational, not financial advice. Test every idea on your own charts before risking money.