What Is Price Action Trading?

Price action trading means making decisions from the price bars themselves rather than from indicators calculated out of them. The readings available are bar size, how fast a distance was covered, where bars keep stopping, and where price went and did not stay.
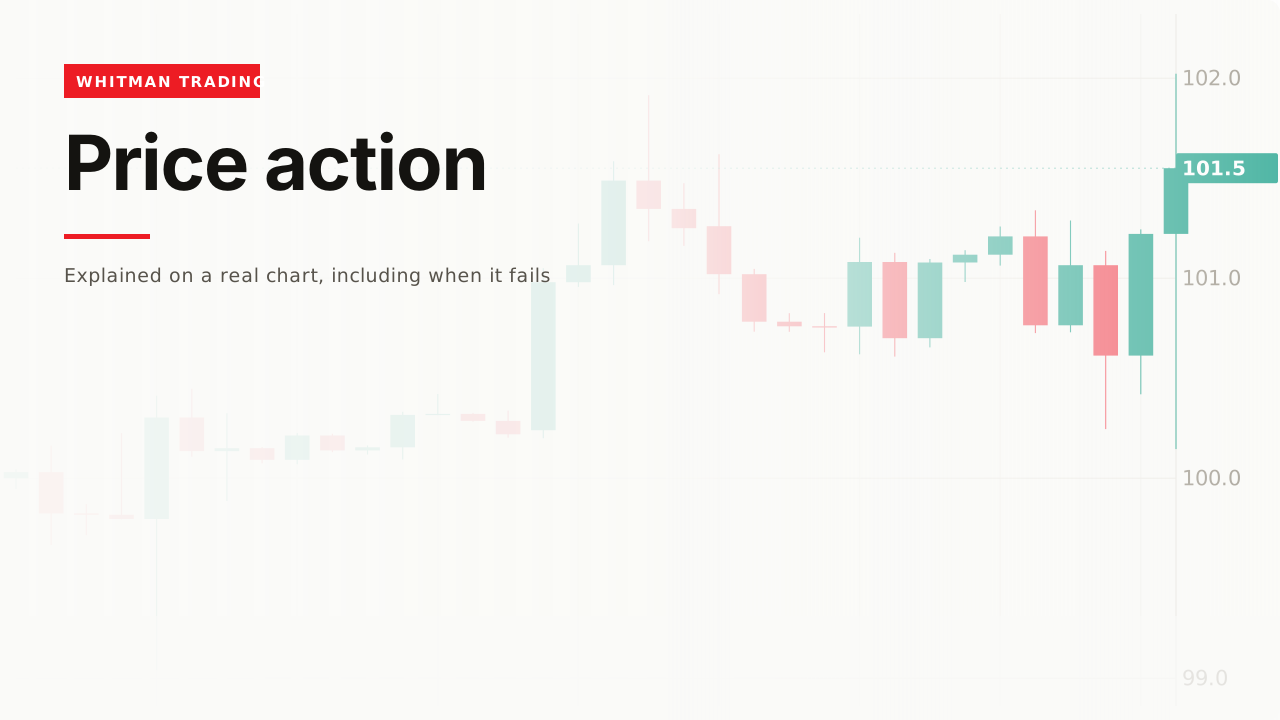
Price action is the most-claimed and least-defined approach in trading. This page is about what readings it actually gives you — there are four — and where the term gets used to mean nothing at all.
How it works
Price action means making decisions from the bars themselves, rather than from something calculated out of them.


Those two charts are the same data. Nothing was added to the second one that was not already derivable from the first — every line on it is arithmetic performed on those closes.
That is the argument for the approach, and it is worth stating carefully: the indicators are not wrong, they are downstream. They arrive later than the bars they are made from, because averaging requires bars that have already closed.
The four readings
Size

A bar much larger than its neighbours means far more happened in that period. Size is relative to the chart in front of you, the same way volume is — there is no bar size that means anything on its own.
Speed

The same distance covered in a quarter of the time is a different event. Distance alone does not capture it, which is why a line chart loses information a candle chart keeps.
Where bars keep stopping

A level found this way came from the bars rather than from a tool, and that is the distinction price action people are usually making when they say they do not use indicators.
Where price went and did not stay

A long wick is a price the market visited and would not hold. It marks where, which is real information, and says nothing about what happens next.
Quiet leads to loud
This is the one price-action reading with a number attached, and it is the most useful thing on the page.

On the chart above the quiet stretch ran at 26% of the chart’s normal bar range, and the bar that followed was 7.3 times the average quiet bar. Those figures are measured off the series, not estimated.
Ranges contract and expand in turns. A market cannot stay quiet indefinitely, so an unusually still stretch is a genuine statement about what is likely to happen next — that something will, not which direction it goes.
A worked example
Read the chart in plain sentences, in order. If you cannot, you do not have a read.
It drifted. Bars of ordinary size, no direction worth naming. Nothing to do.
It went quiet. Bars shrink to about a quarter of normal. Still nothing to do — but this is the part worth noticing, because it is the only reading here that says something about the future.
One bar covered the whole range. Seven times the size of the quiet ones, closing near its high. Whatever was being decided got decided.
It came back and held. Price returned toward that bar’s close and stopped there.

The stop goes under the quiet range, because that range is the thing the expansion broke out of. If price is back inside it, nothing was decided after all — which is a definition of being wrong you can state before you enter.
What a bar cannot show you
One limitation worth knowing early, because it is invisible until someone points at it.
A bar does not record the order things happened in. You get four numbers — open, high, low, close. A bar that opened at 100, ran to 101, fell to 99 and closed at 100 looks exactly like one that fell to 99 first, then ran to 101, then came back.
Those are opposite stories and the chart cannot tell them apart. Dropping to a lower timeframe resolves it, at the cost of a great many more bars to read.
So “reading the bars” has a floor. Below the size of one bar there is nothing to read, and any claim about what happened inside one is inference rather than observation.
Where the term goes soft
Worth saying plainly, because it affects who you learn from.
“Price action trader” often just means discretionary. It is a description of what is not on the chart, which leaves open what the actual decision rule is. Plenty of people use it to mean they look at a chart and form a view.
That can be perfectly legitimate — but it is not a method, and it cannot be tested or taught in the way a rule can. The question to ask of anyone teaching it, including this page, is: what is the rule, and what would make it wrong?
The original data
Across our study of 24,971 trading videos, 668 cover price action. The median one gets 12,828 views, 62% never pass 50,000, and the median length is 16.7 minutes.
The corpus carries description text for 122 of those 668, and across those 122, zero mention invalidation, failure, or what a bad read looks like.
Not a small number — none. On an approach whose defining feature is that it relies on the reader’s judgement rather than a fixed calculation, the absence of any discussion of misreading is the gap, and it is the section directly below.
When it fails
The same reading, the opposite outcome

That is the same compression and the same expansion bar as the chart above, and price went the other way. Nothing in the bars distinguishes them at the moment the expansion closes.
Judgement is not a rule
Removing indicators removes their lag and replaces it with you. On a good day that is an upgrade. On a day when you want a trade, a bare chart offers no resistance at all — there is no line to disagree with you.
This is the honest trade-off, and it runs the other way from how the approach is usually sold.
You are reading it backwards

Every expansion that continued is obvious afterwards. Cover the right-hand side of any chart and read it aloud; most price-action stories get considerably shorter.
Related
Candlesticks is where to start — price action is reading bars, and a bar has four numbers in it that are worth knowing first.
Market structure is price action with the readings written down: highs, lows, and the one price at which the pattern breaks.
And support and resistance is the other half — the prices the bars keep stopping at, which is where most price-action entries actually happen.
The habit that actually taught me this was talking through charts out loud, which I do for hours on livestreams. You end up saying things like: it drifted, then it went quiet, then one bar covered the whole range, then it came back and held. Plain sentences, no jargon. If I cannot describe a chart that way I do not have a read on it - I have a feeling and some lines. The test costs nothing and it catches the trades where I was seeing what I wanted to.
— Michael Whitman, from this video
This page is educational, not financial advice. Test every idea on your own charts before risking money.