What Is Scalping?

Scalping is trading the fastest chart available, holding for seconds or minutes and taking many small moves. Because the move available per trade shrinks faster than the number of trades grows, transaction costs take a larger share of each trade than in any other style.
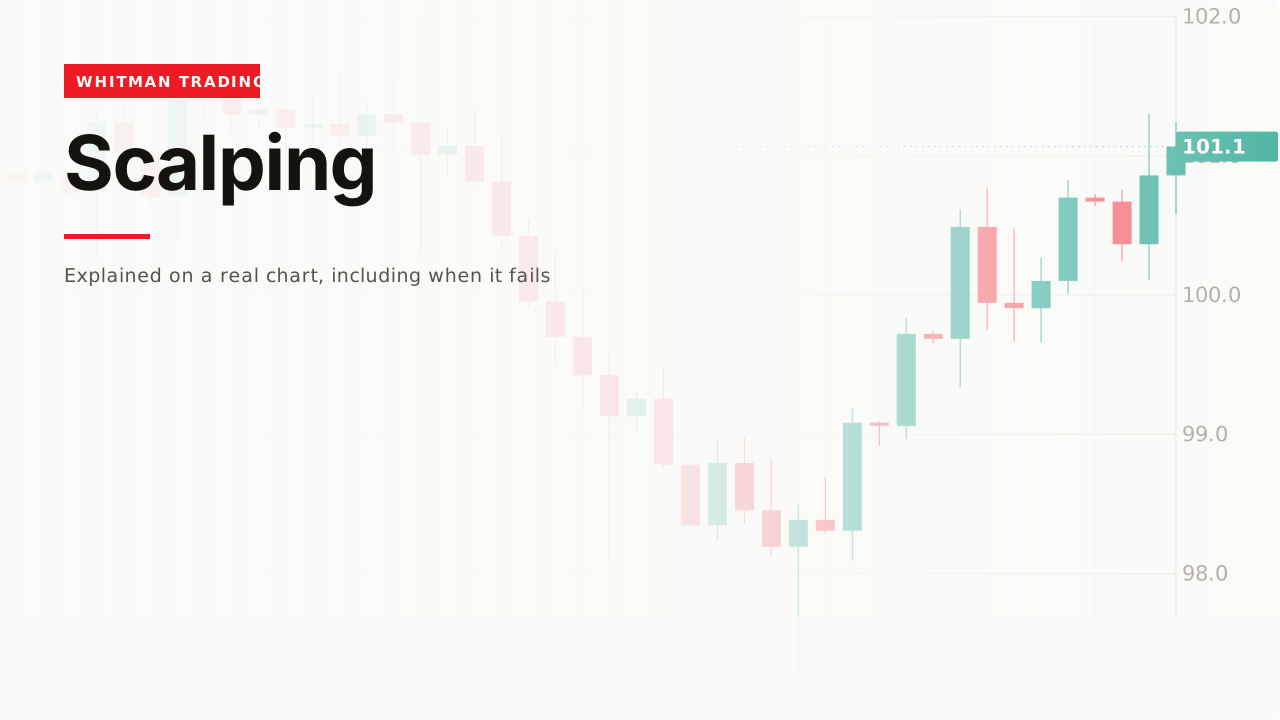
The four style pages on this site are built from one price history, aggregated four ways, so the comparison between them is a measurement rather than an opinion. This is the fastest view of it.
How it works

Hold for seconds or minutes, take a small move, do it again. The shared history is 576 bars at this speed.

Across the whole history the median bar covers 0.49. That is the raw material — the move available inside one bar, before anything is taken out of it.
The cost problem

A 0.02 round trip is 4.1% of that bar.
Here is the same cost against the other three views of the identical market:
| Style | Bars | Typical bar | 0.02 costs |
|---|---|---|---|
| Scalping | 576 | 0.49 | 4.1% |
| Day trading | 144 | 1.17 | 1.7% |
| Swing trading | 48 | 2.26 | 0.9% |
| Position trading | 12 | 3.88 | 0.5% |
Same market, same cost, eight times the burden.
Why the arithmetic works out that way
Trade 48 times more often and each move is only about 8 times smaller — not 48 times.
That is measured in the table above: 3.88 down to 0.49, a factor of 7.9, across a 48-fold increase in trade count.
The reason is that range grows roughly with the square root of time, which is the ordinary behaviour of a price series that wanders. Costs do not — a round trip costs the same whether you held it for ten seconds or ten months.
So the number of costs scales linearly and the size of what you are trading scales with a square root. That gap is the entire economics of the choice, and no amount of skill closes it.
The scale you are working at

The 44 bars at the top of this page sit inside a single candle here.
That is worth holding on to, because it is easy to feel that a fast chart contains more information. It contains the same information at higher resolution, and resolution is not the same thing as edge.
What is actually in the noise

On this 44-bar window price travelled 28.30 and finished 0.19 from where it started.
Across the whole 576-bar history the ratio is starker: 329 of path against 3.60 of net movement — 91 times more travel than progress.
That path is the scalper’s raw material, and it is genuinely there. The catch is in the previous section: capturing more of it means paying more costs.
When it does work, it is usually the costs
The obvious question this page raises is why anyone does it, and the honest answer is not about skill.
The arithmetic above turns on one input you can change: the cost per round trip. Halve it and 4.1% becomes 2.05% — close to day trading’s 1.7%, with nothing about the market having changed.
That is why serious short-term traders spend so much attention on execution. Direct market access, a venue where you can add liquidity rather than take it, and an instrument whose minimum price increment is large relative to its spread all move that one number, and it is the number the whole style rests on.
The implication for someone starting is uncomfortable and worth saying. If your costs are ordinary retail costs, you are attempting the style at its hardest setting, and the fix is a slower chart rather than more screen time.
A worked example
Work out your cost per round trip first. Spread plus commission, both sides. This is arithmetic and it takes two minutes.
Divide it by the size of the bar you intend to trade. 4.1% here.
Decide whether that number is acceptable before looking at a single chart. If it is not, the answer is a slower chart, not a better strategy.
Then the ordinary work applies — a read, a level, and an invalidation, exactly as on the chart reading page. Scalping does not have its own analysis; it has the same analysis on a faster chart with a worse cost structure.
The original data
Across our study of 24,971 trading videos, 966 cover scalping. The median one gets 19,260 views, 63% never pass 50,000, and the median length is 12.4 minutes.
That is the strongest median of the four style pages — above day trading at 14,899, swing trading at 6,307 and position trading at 4,349.
The audience interest runs in exactly the opposite direction to the cost arithmetic. The style with the worst cost structure has the most viewers, and the one with the best has the fewest.
The corpus carries description text for 136 of those 966, and across those 136, three mention invalidation, failure, or what a bad read looks like.
When it fails
Most bars are not worth trading

22 of 44 bars are smaller than the median.

And only 9 ran more than one and a half times it.
Every one of them costs the same to trade. A style that pays a fixed cost per attempt and gets a variable move per attempt has to be selective, and the temptation of a fast chart is the opposite of selective.
The cost is invisible until you total it
4.1% of a bar does not feel like anything. Twenty round trips in a session is a different sentence about the same number, and that is the one worth writing down.
You confused activity with progress
91 times more path than net movement, on this history. A fast chart shows you a great deal happening, and almost none of it goes anywhere.
You picked the trade afterwards

On a finished fast chart the good trades stand out. In the middle of one there are forty bars, most of them small, and no way to tell which is which — which is the same problem as every other page here, arriving many more times per hour.
Related
Day trading is the same history one step slower, and the direct comparison for whether the cost share is worth it.
Timeframes is why the same market looks different at different resolutions.
And risk management matters more here than anywhere, because a high trade count turns a small sizing error into a fast one.
I am not a scalper and the reason is not that I cannot make the decisions fast enough, it is that I did the arithmetic on what I was paying and stopped. What I would say to anyone starting here is to work out your cost per round trip and divide it by the size of the bar you are trading, before anything else. If that number is uncomfortable it does not get better with practice, because it is not a skill problem.
— Michael Whitman, from this video
This page is educational, not financial advice. Test every idea on your own charts before risking money.