What Is Market Profile?

Market profile counts how many time periods traded at each price level, building a histogram of time rather than of volume. The price with the most periods is the point of control, and it is not always the same price a volume profile identifies.
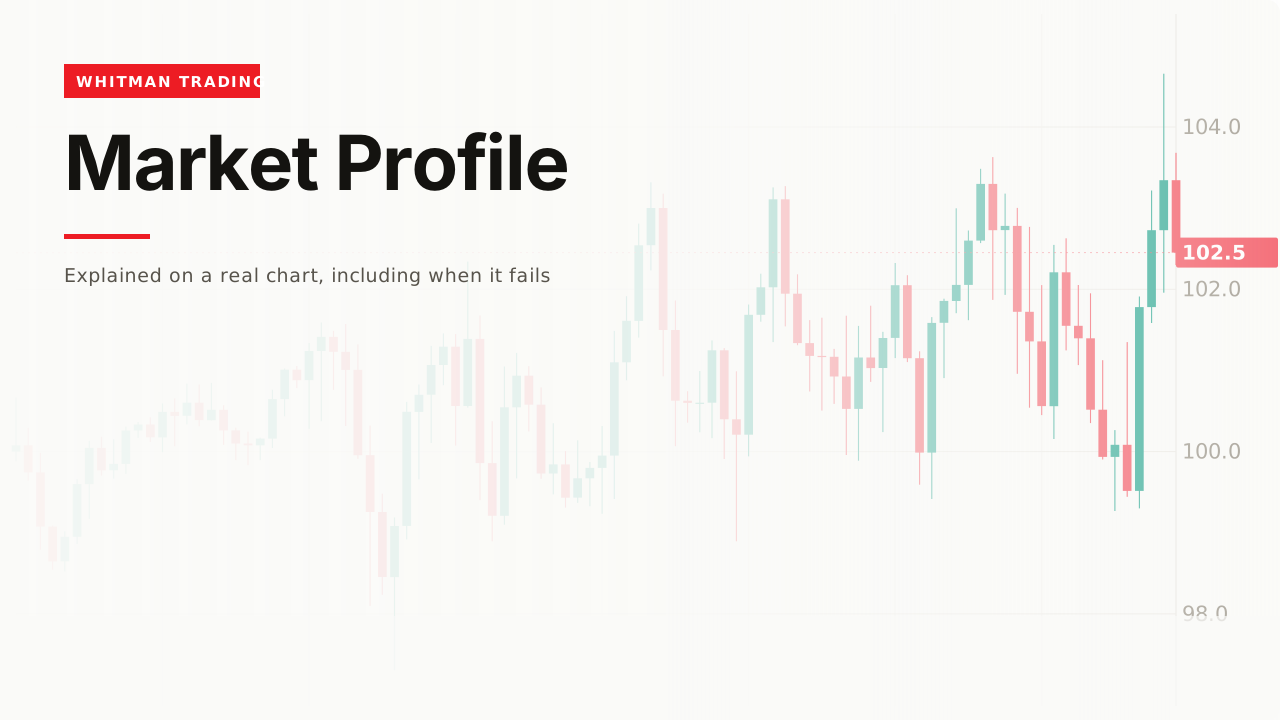
Peter Steidlmayer’s market profile and the volume profile look nearly identical and answer two different questions. On this data they gave two different answers.
How it works

Chop the session into periods. Traditionally thirty minutes each; on this chart, six bars.

For every period, mark every price it traded at. Stack those marks by price and you have the profile: a count of periods, not of contracts.
A price that four separate periods touched scores four, whether those periods were busy or dead.
Where it differs from a volume profile

Measured on identical data: the time-based point of control is 100.48 and the volume-based one is 100.81 — 0.33 apart, about 4.5% of the range.
They disagree because they weight differently. One enormous print at a single price dominates a volume profile and counts once in a time profile. A market that drifted quietly at one price for hours dominates a time profile and barely registers in a volume one.
Neither is more correct. The question is which you meant to ask: where did the most trading happen, or where did the market spend the most time.

Reading the shape

Sixteen periods against one.
A fat row is a price the market kept coming back to — an area of agreement. A thin row is a price it passed through and did not linger at.
The practical reading is the same one the volume profile page reaches: thick areas grind and thin areas travel. Getting there by counting time rather than volume is a different route to the same observation, which is mild evidence the observation is real.
The value area

Widen out from the busiest row until you have 70% of the periods. That band is the value area, and price inside it is in territory the market has already negotiated.
Above or below it is the reading, exactly as on the volume profile page. This is the point at which the two tools become interchangeable in practice, and most people who use one never look at the other.
The letters
Worth explaining, because it is the thing that makes a market profile chart look impenetrable.
The traditional display uses a letter per period — A for the first thirty minutes, B for the second, and so on — printed at every price that period traded at. The stack of letters at each price is the histogram, and the letters carry the extra information of when.
So the shape at the left of the chart is the early session and the right is the late session, which lets you see whether the market found its busy price early or drifted into it.
Most modern platforms draw bars instead, which is easier to read and throws that ordering away. If you have ever wondered why market profile charts look like a page of alphabet soup, that is why — and the soup contained something the bars do not.
A worked example
Establish it is a range first. This is a trading range tool and the next section shows what it does in a trend.
Find the busiest price and the value area edges. Those are the levels, and they came from a measurement rather than from drawing.
Trade the edges, not the middle — being wrong is cheap at the boundary of a negotiated area and expensive in the middle of one.
And the invalidation is a close outside the value area, a price you can name before acting.
The original data
Across our study of 24,971 trading videos, 81 cover market profile. The median one gets 9,116 views, 84% never pass 50,000, and the median length is 15.7 minutes.
15.7 minutes is among the longest medians measured here — roughly double Renko charts at 8.7 — which is what a tool with its own vocabulary tends to require.
The corpus carries description text for 55 of those 81, and across those 55, one mentions invalidation, failure, or what a bad read looks like.
When it fails
A trend produces nothing

In a directional move every price gets touched about once, so the histogram is nearly uniform and there is no point of control worth the name.
That is the correct output and an unusable one. The tool describes where a market has agreed to sit, and a trending market has not agreed to sit anywhere.
The period length is arbitrary
Thirty minutes is a convention from the Chicago pits, not a property of markets. Change it and the counts change — the same objection the volume profile page makes about row counts, arriving through the time axis instead.
The window is chosen
A profile is built over bars you picked. A different start gives a different busiest price, and nothing in the tool tells you which window is the right one.
The vocabulary hides how little is being claimed
Market profile comes with more jargon than anything else in this glossary — initial balance, single prints, poor highs, excess, rotation, and a taxonomy of day types with names.
Underneath, the measurement is one histogram. Every one of those terms is a description of a shape that histogram can take, and none of them adds a second measurement.
That is not an argument against the vocabulary — naming a recurring shape is useful, and the same is true of chart patterns. It is an argument against mistaking a rich vocabulary for a rich model, and this tool attracts that mistake more than most.
You read it once price had left

A completed profile makes the point of control look like a magnet. At the moment price leaves the value area, leaving and coming back are the same picture.
Related
Volume profile is the same histogram counting volume, and the direct comparison above is the fastest way to understand either.
Support and resistance is what a fat row is, read from price instead of from a count.
And trading range is the condition this tool needs in order to say anything.
I treat this and the volume profile as one idea with two settings, and the honest reason I lean on the volume one is that volume is a harder number - it is contracts that changed hands, where time at price is partly an artefact of how I chopped up the session. Where the time version genuinely helps is that it does not care about a single enormous print, so a quiet market that simply sat somewhere for hours shows up properly.
— Michael Whitman, from this video
This page is educational, not financial advice. Test every idea on your own charts before risking money.