What Are Penny Stocks and How Do They Trade?

Penny stocks are shares trading at a very low price, usually in small companies and often away from the main exchanges. Nothing about the technical method changes; what changes is that the spread is large relative to the move, the size available at any price is limited, and gaps are both larger and more frequent.
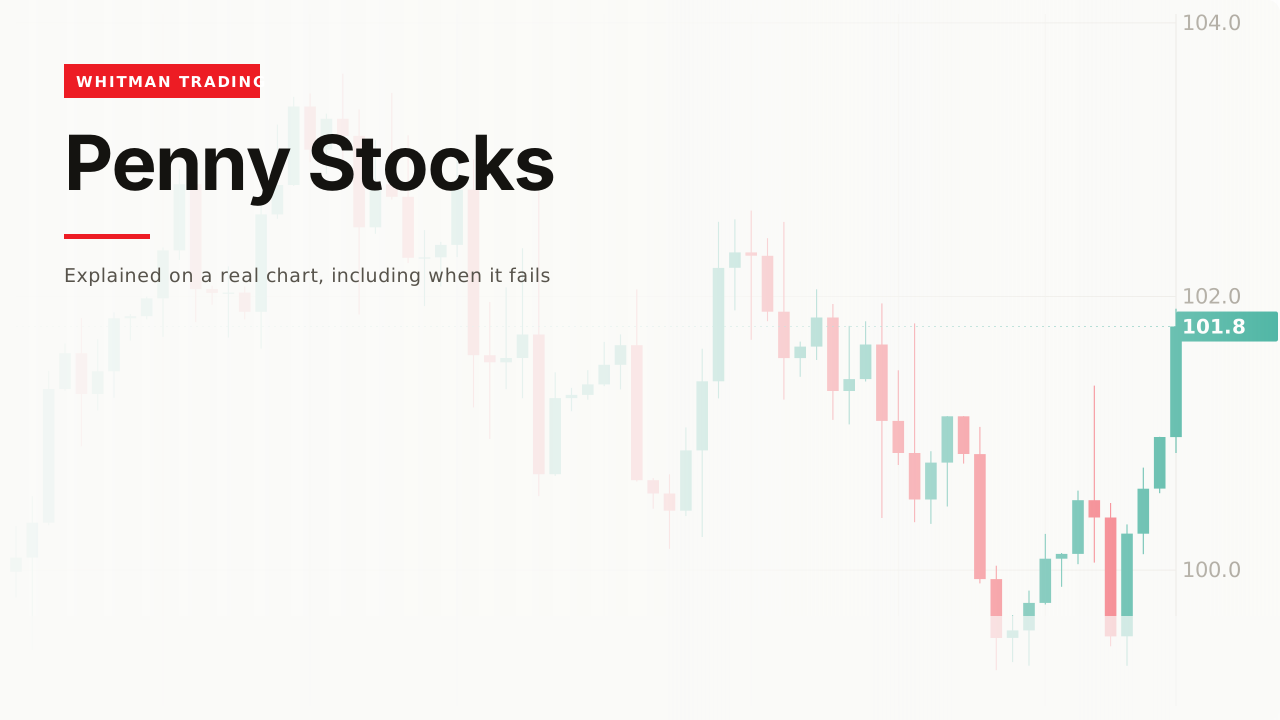
The chart looks the same and the arithmetic does not. Everything difficult about these instruments follows from one thing: there are not many people on the other side.
How it works

A share’s price is not its value. A company is worth its price multiplied by the number of shares in issue, so a low price means a small company, a large number of shares, or both.
“Cheap” in the everyday sense does not appear anywhere in that. A share at a fraction of a currency unit can be expensive and one at several hundred can be inexpensive, and the price alone says nothing either way.
The technical method transfers unchanged. What does not transfer is the cost arithmetic.
One: the spread

On a liquid share, a round trip of 0.02 against a typical bar of 1.17 is under 2%.
On a thinly traded one the bar is far smaller and the spread is often far larger, and the same 0.02 can be a tenth of the move you were trying to keep or more.
That is not a detail — it is the whole economics of the trade. The why traders lose money table shows costs taking 67% of a gross at high frequency on an ordinary instrument; here the multiplier starts much higher.
Measure it before anything else. Spread divided by a typical bar’s range is one division, and it decides whether the instrument is tradeable on your timeframe at all.
Two: the size may not be there

A quote is a price for a quantity. On a thin book, the size available at the best price can be far smaller than the position you want, and the rest of your order fills worse.
Which turns the position sizing formula into a constraint rather than a calculation. The arithmetic may say buy 20,000 shares; the book may only offer 4,000 near the price.
And it works against you at exit, which is when it matters most. A stop is an instruction to leave at the next available price, and on a thin book the next available price can be some distance away.
This is the liquidity page’s mechanism, felt directly rather than as an explanation for why price moves.
Three: they gap

A small company’s news moves its price a long way, because there is less of everything to absorb it.
So the gap risk that all stocks carry is larger here, and the loss a stop did not cover is correspondingly larger.
The only defence is size, decided before the position exists.
Four: the move may have no reason

In thin markets, a modest amount of buying produces a large move.
Which means a chart can show a decisive-looking break driven by very little. That is not a claim about anybody’s motives; it is arithmetic — the same order that barely registers on a large company moves a small one a long way.
Practical consequence: the usual read of a strong move is weaker here. A breakout is meant to be evidence that many participants agreed on a new price, and on a thin book it may be evidence that one did.
Where they trade matters
Not every low-priced share is on a main exchange. Many trade over the counter, through a dealer network rather than a central book, and the disclosure a company must publish differs by venue.
Three practical consequences, all checkable before you trade. The reported volume may be less complete. The spread is typically wider again. And the quantity of published information about the company can be much smaller.
None of that is a verdict on any particular share. It is a reason to know which venue you are on before applying a method built for a central order book.
A worked example
Divide the spread by a typical daily range. If the answer is more than a few percent, this is not a day-trading instrument for you.
Look at the size available at the best bid and offer, not just the price.
Then halve whatever position the sizing formula gives you, because the exit will be worse than the entry.
And size for a gap rather than for the stop if you are holding overnight.
The original data
Across our study of 24,971 trading videos, 192 cover penny stocks. The median one gets 2,758 views, 82% never pass 50,000, and the median length is 9.8 minutes.
The corpus carries description text for only one of those 192, which is the thinnest sample of any topic measured here, and no claim is made from it.
What is readable is the audience. 2,758 median against crypto’s 21,437 and options’ 18,441 — the cheapest instrument to buy has the smallest audience among the speculative ones.
When it fails
The spread ate the edge
A rule with a genuine advantage can still lose money here, purely on costs. That is the failure this page exists to prevent, and it is arithmetic rather than judgment.
You could not get out
Entering a thin position is easier than leaving one. The size that filled quickly on the way in is not necessarily there on the way out, and it is least likely to be there on the day you most want it.
The stop was a suggestion
On a wide-spread instrument a stop can trigger on the spread alone, without the market having gone anywhere. Widening it is not the answer; a smaller position is.
It did nothing for a year


A small company that never grows produces a chart that never goes anywhere, and there is no technical remedy for an instrument nobody is trading.
You judged it from the finished chart

A sharp move on a thin book looks exactly like a sharp move on a busy one, and the difference — how much buying it took — is not on the chart.
Related
Stocks is the general case: the same market, with the costs that make it workable.
Liquidity is the underlying mechanism behind every difference on this page.
And gap trading is the risk that a stop cannot cover, which is larger here.
I do not trade these and the reason is the spread rather than any view about the companies. When I ran the arithmetic on the ones I was watching, the round trip was taking a share of the move that no win rate I could plausibly achieve would have covered.
— Michael Whitman, from this video
This page is educational, not financial advice. Test every idea on your own charts before risking money.