What Is the Squeeze Momentum Indicator?

The squeeze momentum indicator marks periods when the Bollinger band sits entirely inside the Keltner channel, meaning statistical spread has fallen below typical bar range. It signals that volatility is low; it contains no information about which direction the market will move next.
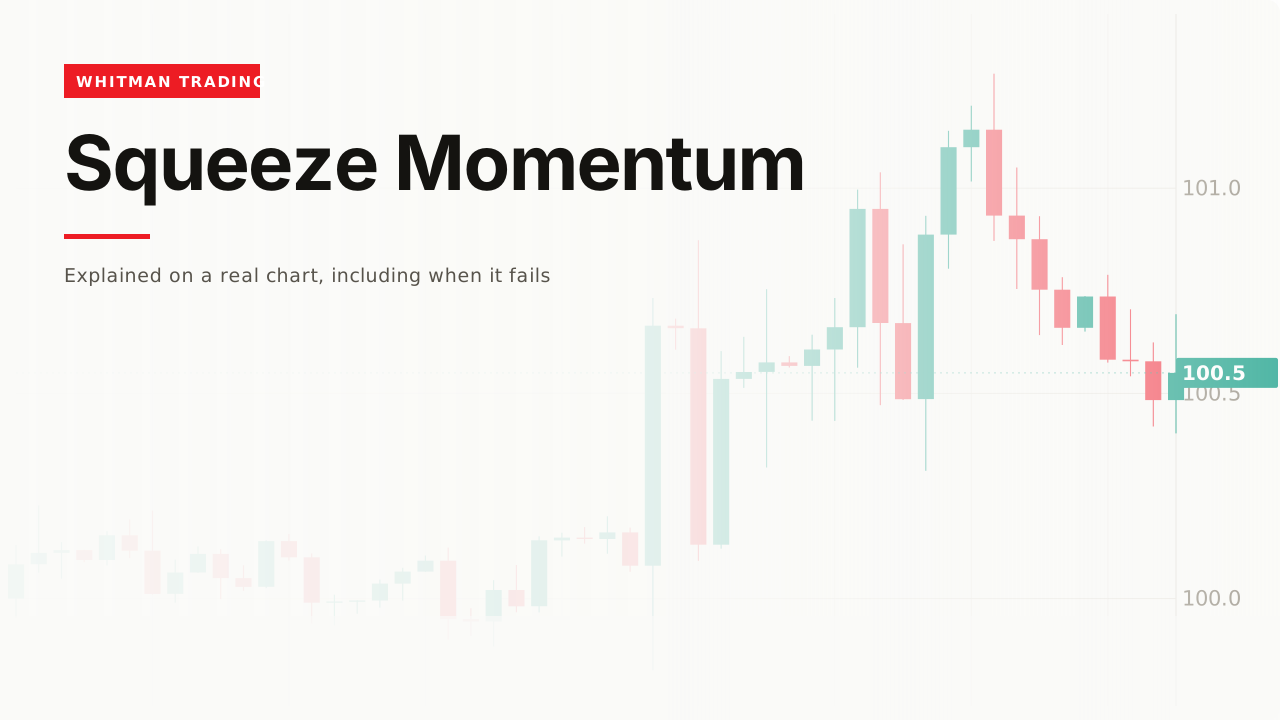
John Carter’s squeeze, popularised on TradingView by LazyBear, is the one indicator here that is built entirely out of two other indicators — and knowing that is most of knowing how to read it.
How it works

Draw Bollinger Bands and a Keltner Channel on the same price. Bollinger at 20 bars and 2 standard deviations; Keltner at 20 bars and 1.5 ATR.

When the Bollinger band sits entirely inside the Keltner channel, the squeeze is on.
That is the whole test. On this chart it was on for 9 bars, from bar 19 to bar 27.
What that comparison actually means

It is one measure of spread falling below another.
Standard deviation measures how much closes vary around their average. ATR measures how far a typical bar travels. When the first drops below the second, closes have clustered more tightly than bar ranges would suggest — the market is moving within each bar but going nowhere across them.
Measured here the ratio ran from 0.66 to 1.52. Below 1.0 is the squeeze, and the tightest reading was a third below it.
That is a real, specific observation about market state, and it is the only thing this indicator measures.
It has no direction

A squeeze is a statement about size. The move out of it goes wherever it goes, and nothing in the comparison of two symmetrical channels can favour one direction.
This is the same honest limit the Bollinger squeeze section reaches, and it is worth being blunt about because the indicator is usually presented alongside a directional story.
The histogram is a separate thing

The coloured bars in the panel are not the squeeze.
They are a linear regression of price against the midpoint of the recent range — a momentum calculation that shares the panel and shares the lookback and has nothing to do with whether the Bollinger band is inside the Keltner channel.
Two unrelated measurements in one window. The squeeze is a dot or a colour on the zero line; the histogram is the momentum. Reading the histogram’s colour as “the direction the squeeze will fire” is combining two things that were never combined.
The timing is loose

Fourteen bars apart on this chart.
The usual phrasing is that the squeeze “fires” and the move follows. What actually happens is that volatility rises enough for the Bollinger band to escape the Keltner channel, and that can happen well before anything directional occurs.
So it is not an entry trigger. It is a note that the quiet period has ended, which is a different and much weaker claim.
Why the comparison works at all
Worth one section, because it explains why anyone chose these two channels rather than simply watching one of them narrow.
A single channel narrowing tells you very little on its own. Every instrument has its own normal width, and every timeframe has a different one, so “the Bollinger band looks tight” is a judgment about a chart you happen to be familiar with.
Comparing two channels removes the scale. Because both are measured on the same price over the same window, their ratio is a pure number — 0.66 means the same thing on a currency pair and on a share, on a one-minute chart and on a weekly one.
That is the actual innovation here, and it is the same trick CCI uses by dividing distance by mean deviation: express a measurement in units of another measurement and the instrument drops out.
It also explains the choice of two. Standard deviation and average true range respond to a shock differently — one squares outliers and the other does not — so the ratio moves when the character of volatility changes, not merely its level. Two channels built the same way would give a constant.
A worked example
Squeeze on: do nothing. That is the correct response and the hardest one. The market is coiled and you do not know which way.
Mark the levels while you wait — the range high and low from price, which is where the breakout page takes over.
Squeeze off: still do nothing on its own. Wait for price to leave one of those levels.
The invalidation is a return inside the range, a price you named while nothing was happening.
And ignore the histogram colour unless you separately decided a momentum reading was part of your method.
The original data
Across our study of 24,971 trading videos, 65 cover the squeeze. The median one gets 3,265 views, 82% never pass 50,000, and the median length is 9.5 minutes.
The corpus carries description text for 50 of those 65, and across those 50, four mention invalidation, failure, or what a bad read looks like — one in twelve, which is a better rate than most indicator topics measured here.
When it fails
Sideways it fires and nothing happens

A quiet market can simply stay quiet, or get slightly less quiet and then quiet again.
The observation underneath the indicator — that low volatility tends to be followed by high volatility — is a tendency over many instances, not a promise about this one.
The move goes the other way
A squeeze that resolves downward is exactly as consistent with the tool as one that resolves upward. Any sense that it “should” break up came from somewhere other than the arithmetic.
The histogram is read as the answer
Covered above and it is the failure specific to this indicator. Two calculations, one panel.
You judged it once it had resolved

Every squeeze that preceded a big move looks like a signal afterwards. During one, there is a narrow channel and no information about direction, which is precisely what the indicator is correctly reporting.
Related
Bollinger Bands is one half of the comparison, including what standard deviation actually measures.
Keltner Channels is the other half, and why ATR width behaves differently.
And breakout is what you are waiting for once the squeeze ends — and how often it does not work.
What I like about this one is that it is honest about being a filter - it is telling you the market is coiled and explicitly not telling you which way. What people do with it is the problem. The histogram is a completely separate calculation that happens to sit in the same window, and treating its colour as the direction of the coming move is reading two unrelated things as one signal.
— Michael Whitman, from this video
This page is educational, not financial advice. Test every idea on your own charts before risking money.