What Is the Money Flow Index?

The Money Flow Index is a 0–100 oscillator built like RSI, but each bar's move is multiplied by that bar's volume before the up and down totals are compared. A move on heavy volume therefore counts for more than the same move on light volume.
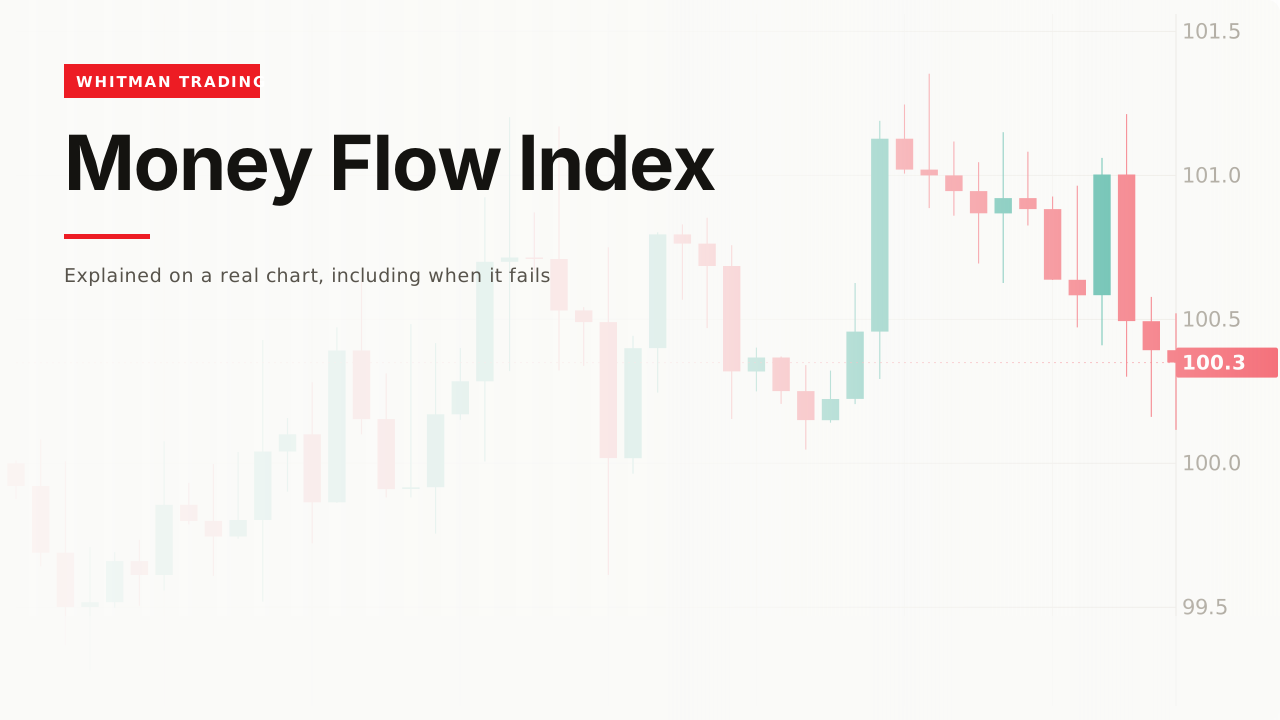
Take RSI, multiply every bar by how much traded, and you have this. Whether that is an improvement depends entirely on whether your volume figure means anything.
How it works

Four steps:
typical price = (high + low + close) / 3
raw money flow = typical price × volume
Sum the raw money flow on bars where the typical price rose, sum it on bars where it fell, and compare the two over 14 bars:
MFI = 100 − 100 / (1 + positive flow / negative flow)
That last line is RSI’s formula exactly. The only difference in the whole indicator is that each bar arrived pre-multiplied by its volume.
What the volume actually changes

Measured on this chart, the two read 33 apart at their widest — MFI at 78 while RSI said 45.
That gap is the entire value proposition. If it were small, the volume weighting would be decoration and you could use RSI.

A bar with three times the volume counts three times. So a rise on thin participation scores lower than the same rise on heavy participation, which is a genuinely different question from the one RSI asks.
The zones

80 and 20, where RSI conventionally uses 70 and 30.
The narrower band is deliberate: because volume weighting makes the series swing harder, the same “unusual” threshold sits further out. On this chart it passed 80 on 5 bars and never reached 20.
The reading people run it for

Price made a higher high — 100.92 then 101.35. The Money Flow Index went from 84 to 46.
The story: the second push happened on less money. The honest status of the story: it is the same class of claim as RSI divergence, and it has to resolve before you know whether it meant anything.
What is different here is that the disagreement has volume in it rather than being two views of price — which makes it a genuinely second measurement rather than the same one twice.
The volume problem
This is the section that decides whether the indicator is usable at all.
In stocks and futures, volume is a real reported number — contracts or shares that actually changed hands on an exchange.
In spot forex there is no such number. There is no central exchange, so your platform shows tick volume: how many price updates arrived, not how much traded. That correlates with activity, and it is not the thing the formula asks for.
In crypto, volume is real but venue-dependent, and on some venues it has historically been inflated.
So the honest rule is: use it where volume is audited, and use RSI where it is not. Running MFI on a currency pair is running a volume indicator on a number that is not volume.
The settings

One number: the lookback, 14 by default — the same 14 RSI uses, and for the same reason, which is that Wilder picked it.
Shortening it produces more zone touches and no more information, the trade every oscillator on this site makes.
Typical price is doing quiet work
Worth pulling out, because it is a second difference from RSI that nobody counts.
RSI is calculated on closes. This is calculated on (high + low + close) / 3.
That changes which bars count as up bars. A bar can close lower than the previous close while its typical price rises — a session that opened badly, traded a wide range and finished near the middle will do exactly that. RSI files it as a down bar; the Money Flow Index files it as an up bar.
So the two series can disagree before volume is even involved. Some of the 33-point gap measured above is the weighting, and some of it is simply that the two indicators are counting different bars as positive.
The practical consequence is small but worth knowing: if you switch from RSI to MFI expecting only “the same thing with volume”, you will occasionally see the two point opposite ways on a bar where nothing about volume was unusual. That is the typical price, not the money flow.
A worked example
Check that volume is real for this instrument first. If it is not, stop here.
Establish the condition from market structure. Like every oscillator, this is a trading range tool and will read extreme through a trend.
Then use the reading as a second reason, never a first one — a level from price, and MFI agreeing with it.
And the invalidation is a price, from the chart. Nothing on a 0–100 scale gives you one.
The original data
Across our study of 24,971 trading videos, 52 cover the Money Flow Index. The median one gets 3,407 views, 88% never pass 50,000, and the median length is 8.8 minutes.
That is a low median on a small field — below CCI at 12,334 and ADX at 17,429, both of which are similarly obscure tools.
The corpus carries description text for 48 of those 52, and across those 48, two mention invalidation, failure, or what a bad read looks like.
When it fails
In a trend it stays extreme
Covered on every oscillator page here and true again: the 5 bars above 80 on this chart were inside an advance. Volume weighting does not fix the structural problem, because a rising market makes higher highs on real volume.
Sideways it crosses the zones constantly

And the range is where it is supposed to work, which is the awkward version of the same observation the stochastic page ends on.
The volume is not volume
Covered above, and it is the failure specific to this tool. Every other objection on this page applies to RSI too; this one is the price of the improvement.
You found the divergence afterwards

Divergences that preceded a turn are obvious in retrospect. The ones that preceded another leg up look identical at the time, and there are more of those.
Related
RSI is this formula without the volume, and the comparison above is the whole argument for using either.
Volume is the input that makes the difference, including when it is trustworthy.
And On Balance Volume is the other way to fold volume into a line — cruder, and easier to read.
I use this instead of RSI when I am looking at something with real volume behind it, which for me means stocks and futures rather than currency pairs. The reason is narrow: I want to know whether a move had participation, and RSI genuinely cannot tell me. What I do not do is treat the divergence as a signal on its own, because I have watched plenty of them resolve by price simply carrying on.
— Michael Whitman, from this video
This page is educational, not financial advice. Test every idea on your own charts before risking money.