What Is the Ichimoku Cloud?

Ichimoku is a set of five lines. Tenkan, kijun and senkou span B are the midpoint between the highest high and lowest low over 9, 26 and 52 bars. Senkou span A is the average of tenkan and kijun, and the two spans are plotted 26 bars ahead to form the cloud. The lagging line is the close plotted 26 bars back.
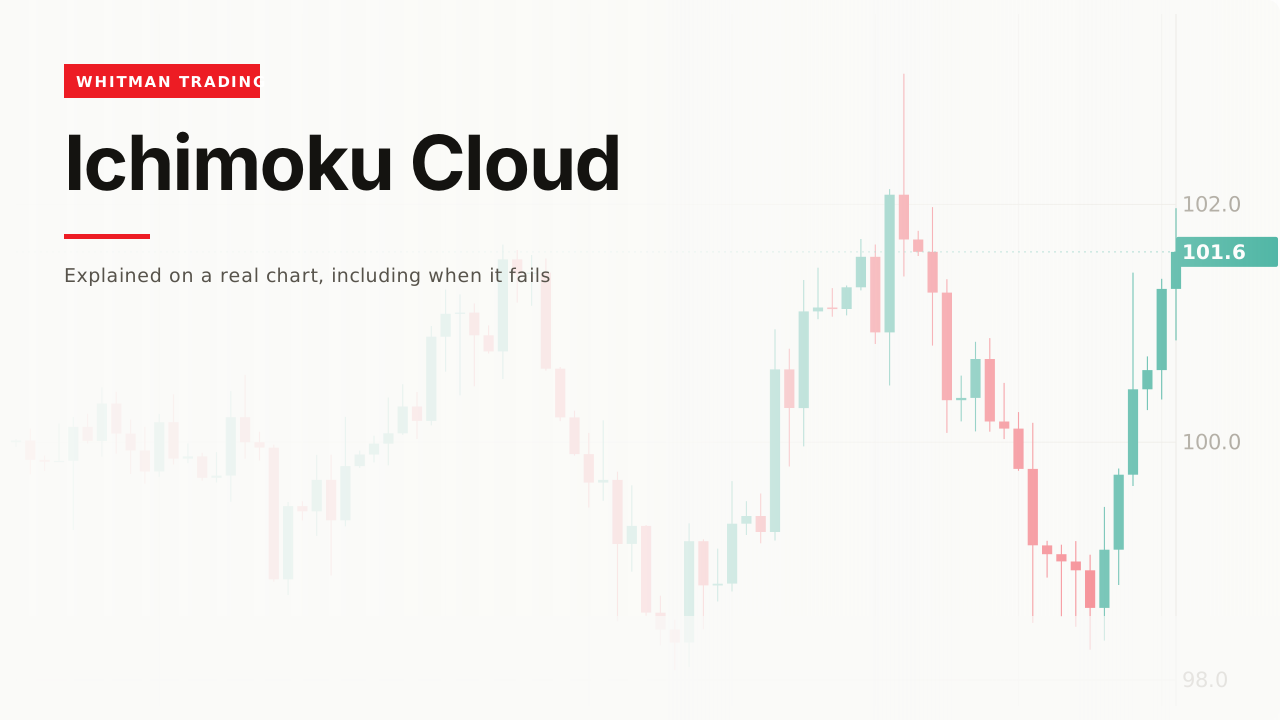
The most crowded indicator most people ever put on a chart. What follows is what each line is made of, which turns out to be the part that is usually skipped.
How it works

Five components, and three of them share one formula.
Tenkan = (9-bar high + 9-bar low) / 2
Kijun = (26-bar high + 26-bar low) / 2
Senkou span B = (52-bar high + 52-bar low) / 2
Senkou span A = (Tenkan + Kijun) / 2
Chikou = today's close, plotted 26 bars back
The two spans are plotted 26 bars ahead, and the area between them is the cloud.
They are not moving averages

This is the thing worth taking away and it changes how the lines behave.
A moving average uses every close in its window. Kijun uses exactly two numbers: the highest high and the lowest low. Every close in between is discarded.
Measured on the last bar of this chart: kijun is 100.68 and the 26-bar average is 100.45. Different numbers, because they are answering different questions.
The consequence is that kijun goes flat and stays flat. If no new 26-bar extreme is made, the midpoint does not move at all — so it produces genuine horizontal levels the way an average never does, and those flat stretches are the most useful thing on the chart.
The cloud

The displacement is the idea. The cloud you see over today’s candle was computed from price 26 bars ago, and the cloud drawn over the next 26 bars already exists — it continues past the last candle, off the right-hand edge of this chart.
So it is support and resistance you can see before price arrives, which no other tool on this site offers. Whether it works is a separate question; the construction is genuinely different.

The reading is which side. Price above the cloud is the bullish condition, below it bearish, inside it undecided — and “undecided” is a real answer that most indicators will not give you.
Thickness

A thick cloud is the two spans disagreeing, which means the 52-bar range and the shorter ones are in different places — a market that has moved a long way recently.
Measured on this chart the thickness ran from 0.07 to 0.50 — seven times.
The conventional reading is that a thick cloud is harder to break through and a thin one is easy. Treat that as a plausible story rather than a demonstrated fact, and note that a thin cloud is also where the indicator is least sure of anything.
The lagging line

Chikou is today’s close, moved 26 bars into the past. It contains no calculation at all.
The point of it is comparison. If today’s close sits above the price of 26 bars ago, then everyone who bought in that window is in profit. That is a real thing to know, and it is the same observation the premium and discount page makes about position.
A worked example
Which side of the cloud. Above, on this chart, at 101.60 against a cloud top of 99.87.
Is kijun flat. A flat kijun is a level; a sloping one is just a line. This is the check that tells you whether the chart has anything horizontal on it worth using.
Is chikou clear of the price it is sitting over. If it is tangled in old candles, the last 26 bars were a range and the read is weak.
The invalidation is a close back inside the cloud, which is a price you can name before you act.
All four, or none. This is a system with agreement built into it, and taking one line out of it is taking the one thing it was designed to avoid.
The original data
Across our study of 24,971 trading videos, 154 cover Ichimoku. The median one gets 10,080 views, 79% never pass 50,000, and the median length is 11.9 minutes.
11.9 minutes is among the longest medians here, against 8.5 for the stochastic and 8.7 for Supertrend — which is what you would expect from a tool with five components rather than one.
The corpus carries description text for 71 of those 154, and across those 71, zero mention invalidation, failure, or what a bad read looks like.
When it fails
In a range everything tangles

Price sits inside the cloud, the two fast lines cross repeatedly, and chikou is buried in old candles. Every component says “no read”, which is the correct answer and not a useful one.
The honest version: Ichimoku is good at telling you it does not know, and people rarely accept that as an output.
The 26 is not universal
The numbers 9, 26 and 52 come from a six-day trading week — 26 was roughly a month of sessions when Goichi Hosoda published the system in the 1930s. Markets run five days now, and the numbers were kept anyway.
That is not automatically wrong — a widely used setting is self-fulfilling for the reason on the support and resistance page — but “the numbers are optimal” is a claim nobody has demonstrated.
You used one line from it
Covered above, and it is the most common failure. The kijun on its own is a 26-bar range midpoint and nothing more. It is not Ichimoku, and it does not carry the agreement the system is built on.
You read the cloud after price went through it

A cloud that held is obvious afterwards. At the moment price arrives underneath it, a thick cloud that stops the move and a thick cloud that gets cut through look exactly alike.
Related
Moving average is the comparison that makes these lines make sense — same appearance, different arithmetic, different behaviour.
Support and resistance is what the cloud and a flat kijun actually are, reached from price instead of formula.
And market structure is the read to have first, because it tells you whether this is a chart where the system will say anything at all.
I do not run this, and the honest reason is that it puts five lines on a chart when I can get the same read from two. What I do think is genuinely clever about it is the displacement, because a level drawn from data that is twenty-six bars old and projected forward is a much more interesting object than another average. If someone told me they used it well I would believe them. It is a real system rather than an indicator, and half-using it is worse than not using it.
— Michael Whitman, from this video
This page is educational, not financial advice. Test every idea on your own charts before risking money.